

Tune out the noise. Concentrate on the significant.
Milwaukee, Wisconsin
Joined September 2020
- Tweets175
- Following15
- Followers1.3K
- Likes63




Pinned Tweet
Not everything that is important can be measured.
Not everything that can be measured is important.
Hi Mount Research retweeted

The market goes through a 4 step process to transition from a downtrend to an uptrend. The process isn't always linear. Retests (step 3) can fail, resetting the process to step 1. In rare cases the market skips step 3, also known as a V-bottom.
Where are we? A 🧵@NDR_Research 1/5

The % of global mkts >50d avg dipped below 70% last week.
Now it has dropped below 40%.
The % of global mkts >200d has broken below 80%.
Too early to tell if this is a healthy reset or the beginning of a global breadth breakdown, but it bears watching.

During the first year of President Trump's return to the White House, the S&P 500 was up 13%, the rest of the world was up 31% and Gold soared 75%.


Hi Mount Research retweeted

"While domestic breadth has been uneven, global breadth strength has been resilient. The percentage of global markets above their 50-day average is in the 80’s and the percentage of markets above their 200-day average is in the 90’s."
@WillieDelwiche @HiMountResearch

Hi Mount Research retweeted

🇺🇸 US Breadth 👉 Uneven
🌏 Global breadth 👉 Resilient
The percentage of global markets above their 50-day average is in the 80’s and the percentage of markets above their 200-day average is in the 90’s.
via @WillieDelwiche of @HiMountResearch

Hi Mount Research retweeted

And we know the worst and best days tend to occur next to each other.
So what happens if we miss the best and worst days?
Better returns, lower vol, lesser drawdown. Trend followers are onto something..
h/t @HiMountResearch Aug 2024, @topdowncharts May 2025 and @CarsonGroupLLC Apr 2025


10 worst days in the S&P 500 this decade
What do they all have in common?
They all occurred when the $SPX was below its 200-day moving average

Overall unemployment rate has been stable in recent months, but extended (15+ weeks) unemployment rate is rising like it usually does in recessions (& is already above its long-term median).
Persistent inflation and deteriorating labor conditions have the Fed in a tough spot.

The market will let us know if we can look past these macro machinations.
himountresearch.substack.com…

Once again, when you lose the bulls you lose the bull market.
You don't need a crystal ball to navigate the market, but you do need to have your head up and your eyes open.

After longest period of sustained strength in stocks vs bonds in over a decade, the trend is turning away from stocks and toward bonds.

A rally that cannot produce a Breadth Thrust is a rally that should not be trusted. himountresearch.substack.com…

Hi Mount Research retweeted

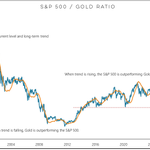
Gold is hitting new highs and its strength has been persistent.
It has outperformed the S&P 500 over the past month, the past year and the past 3 years.
It has also outperformed every sector in the S&P 500 over the past month, the past year and the past 3 years.

Hi Mount Research retweeted
Last week's rally had a feel good quality but it was not enough to turn our sector breadth model positive.


Now at 11 and still counting. . .

"We are 10 trading days into the 'best month of the year for stocks' and every day so far has seen more decliners than advancers on the S&P 500."
@WillieDelwiche @HiMountResearch

Hi Mount Research retweeted
We've moved out of the breadth regime triggered by last December's spike in new 20-day highs and global market conditions remain challenging.
History suggests that under such conditions weakness from the S&P 500 should not be a surprise. @HiMountResearch

It would be unprecedented for full-time employment to contract on a year-over-year basis and the economy not experience a recession.
Full-time employment peaked 18 months ago and has been negative on a year-over-year basis since February.

