

📈 Full-Time Crypto Trader (9+ Years | 20K+ Hours) 📚 Psych | Cycles | PA | Vortex △ | Astro | Fib 🖥️ CTO | INTP Creator of the Hawk Liquidation Theory
Not Financial Advice
Joined September 2020
- Tweets1.3K
- Following115
- Followers1.5K
- Likes1.4K





Pinned Tweet
First wave is nearing completion, like clockwork.
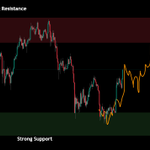
A clean 50% pump from our 58k bottom. After the final fumes exhaust here, it's going back to low 70s.


With the below played out, it's time to re-evaluate the HTF projection. At this stage, we are likely seeing a lot of capitulation into support - months of negative sentiment, wars and economic panic.
All as we expected, of course. While the sub 10k levels are active (circa 2029 projected target), the immediate focus right now on the medium term is generally towards the upside.
It would be very natural at this stage, to see Bitcoin re-test 108k one more time, and given how oversold altcoins are, they should see a significant rally (Even a DCB would mean several X runs on many coins).
One word of caution, as the probabilistic nature of markets dictates that we be aware of alternative plays; should this strong support start seeing a breakdown, we will see sub 25k very quickly.

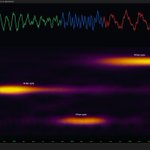
We're releasing another free, open-source indicator called: Neural Spectrogram Heatmap [AI Cycle Prediction]
This indicator calculates the varying market vibrations and uses neural networks to predict the most likely temporal turning points.
Script and Guide:
tradingview.com/script/K7i5e…


Together with this launch, our free Crypto Liquidation Heatmap got updated as well, to display far higher quality visuals.
tradingview.com/script/32PMF…

Today we're launching PineCanvas Library on TradingView!
This software enables far higher resolution graphics on the platform than previously was possible, allowing for all kinds of tools from heatmaps, to animated HUDs, various profiles and more.
The library allows rendering of over 1 million pixels for graphics, and breaks through the old 500 box limit that all heatmaps and volume profiles were limited to, easily pushing upwards of 24,000 boxes.
tradingview.com/script/KqYfT…

Liquidity injections starting.. as expected.
Bitcoin will be trading at 108k, don't miss the exit.

BREAKING: The US Treasury announces it will double the size long-term US government debt buybacks following the rapid surge in US Treasury yields.
Repurchases of $2 billion will now be increased to "at least" $4 billion, the US Treasury said.
The move is intended to provide "liquidity support" for bonds maturing in 10 to 30 years as total US debt nears $40 trillion.
There is the intervention we have been calling for.
It is an honor for Alien_Algorithms to form part of the @TradingView Creator Program.
For those that have been following our indicators, the Institutional Imbalance Framework is now purchasable directly in the TradingView Store.
You can find it in the Indicator panel -> Store -> Alien_Algorithms
Access: tradingview.com/spaces/Alien…
Docs: docs.alienalgorithms.com/Ins…

With the below played out, it's time to re-evaluate the HTF projection. At this stage, we are likely seeing a lot of capitulation into support - months of negative sentiment, wars and economic panic.
All as we expected, of course. While the sub 10k levels are active (circa 2029 projected target), the immediate focus right now on the medium term is generally towards the upside.
It would be very natural at this stage, to see Bitcoin re-test 108k one more time, and given how oversold altcoins are, they should see a significant rally (Even a DCB would mean several X runs on many coins).
One word of caution, as the probabilistic nature of markets dictates that we be aware of alternative plays; should this strong support start seeing a breakdown, we will see sub 25k very quickly.
BTC Macro Update
First of all, I want to say if anyone has been liquidated during last night's altcoin capitulation, do not despair. For many, this is an initiation rite into the more advanced stages of being a trader, the moment of humbling where the ego dissolves and you become far more objective and resilient. Money is just a tool, you will make more, but this experience is priceless. Almost every successful trader that I know, has been on the brink of total annihilation at least once - including myself in the early days.
Going forward, the current Bitcoin view remains largely the same as before, we are still in the major resistance that I've been speaking about for years, albeit in the very final stages now. As you can see, the price action has been inside an inducement stage (HLT) for a while now, and we are very close (relatively speaking) to entering the Liquidation stage.
It is my belief that Bitcoin is largely going to range between 105k and 130k for the next few months, till the next major Astro date (19th Jan 2026). Around that time, we should already be seeing signs of reversal down.
Till then, I believe we're going back to ATH (forming the HTF topping formation / distribution), and according to the cycle theory, Altcoins should be outperforming.


Since I have gotten a lot of requests on how to use the NeuraLib Deep Learning Runtime in PineScript, I have created a free, open source indicator.
This acts both as a demonstration of the library techniques, its potential in smart-indicator applications and for the non-devs a neural powered indicator to experiment with in market analysis.
You can find it on my TradingView profile.

Can you see what the Institutions are doing with Bitcoin?
For the last two months, there has been classic bullish order flow with high volume bidders (whales and institutions) stepping in at key OrderBlock zones.
Until recently in the middle of May, an imbalance in the regular flow has occurred, where a large amount of Bids have been absorbed by sellers. This happens when a trend gets overcrowded and the nature of the bids shift from smart flow to retail flow.
Following this absorption of bids, we have seen a structural shift downwards and a new bearish OB form, effectively trapping the retail buyers below breakeven.
Now that the institutional target has been reached and liquidity taken, we are seeing fresh bids come in.
Here is how the Institutional Imbalance Framework (link in Bio) was able to show us key OrderBlocks, Structure Shift thresholds and even the Institutional Liquidity Target (72.5k):

Here's a follow up, looking at the Institutional Framework:
First thing we can see is that the Bullish Structure Shift Line from the previous update did not break, price could not clear above 74k and so the squeeze into the 77k liquidity pool could not happen.
Second thing we can see, is that we have a significant liquidity pool at 72.2k. Given that we are currently in bearish order flow, that is a zone that will likely be defended for now.
The ideal case here, is that we pump from around 66k into that liquidity pool, and then come back to re-test the lows. This would make a better foundation to attack that Red OB and Shift line at 74k.

Bearish Order Flow continues without any bullish shifts, and no real pullbacks yet to short on.
Looking at a 3D chart though we can see one point of interest being 57k, where this HTF Bullish Order Block gets fully mitigated.
After that, the immediate HTF liquidity sits around 78k, with higher targets later.
The CVMI Oscillator (probability gauge) is also in bullish territory last seen at 15k lows in 2022.

I recommend that you evaluate all the analyst accounts you follow with such a Grok prompt (use Expert for attention to detail).
Grok's assessment of my profile: 80% - 85% success rate.
xitter.cf/i/grok/share/5fc4771cc…