






Hallway Mathlete retweeted
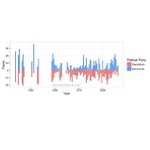
College Majors with Fewer Women tend to have Larger Pay Gaps hallwaymathlete.com/2016/11/… #PayGap

Hallway Mathlete retweeted

May you always inspect your data as skeptically and rigorously as David did with Michael Crichton’s fictional data on dinosaur heights.
This Post is from an account that no longer exists. Learn more


Hallway Mathlete retweeted

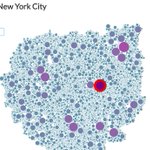
These four maps show the same exact data, but look wildly different. What the? Here’s why: beta.observablehq.com/@mbost…


Hallway Mathlete retweeted

Great interactive graphics on a super interesting subject. xitter.cf/mbostock/status/100509…

What can cause cycles in predator–prey 🐈🐁 populations? Let’s use visualization to explore a dynamical system! beta.observablehq.com/@mbost…

Hallway Mathlete retweeted

I love this fact: average walking speed increases predictably as city size increases, roughly as N^{0.1}, where N is city population. pnas.org/content/pnas/104/17…

Hallway Mathlete retweeted
This is hands down one of the most entertaining machine learning videos I have ever watched. If you are interested in learning how AI and machine learning works, this is a fantastic resource. xitter.cf/SEFDStuff/status/93926…

NEW VIDEO! It's time to write a fun #MachineLearning bot! Join me as we try to train Forrest to become an Any-Course-Running Master using #NeuralNetworks! youtube.com/watch?v=ZX2Hyu5W…

Hallway Mathlete retweeted
This is a great mini-class in game theory xitter.cf/ncasenmare/status/8899…

Trust is falling. Why? And how can we fix it?
My interactive guide to the game theory of trust is now OUT!
👉 ncase.me/trust/ 👈

Hallway Mathlete retweeted
Statistics can be deceiving! All of these datasets have the same mean, standard deviation and Pearson's correlation.
autodeskresearch.com/publica…


Even Mark Cuban is learning data science! xitter.cf/mcuban/status/84678134…


Hallway Mathlete retweeted
See what the Trump campaign can infer about you from your Facebook profile.
Here: applymagicsauce.com/
xitter.cf/hallwaymathblog/status…

How Donald Trump's Campaign data mined Facebook profiles to tailor campaign messages to potential voters motherboard.vice.com/en_us/a…
How Donald Trump's Campaign data mined Facebook profiles to tailor campaign messages to potential voters motherboard.vice.com/en_us/a…
Hallway Mathlete retweeted

Follow @BestofData to see the best data mining and visualizations articles on the web.
Hallway Mathlete retweeted

Republicans in general more likely to view other countries unfavorably... with one exception, new for 2017 nytimes.com/interactive/2017…
Great data visualizations exploring what people believe makes you part of a certain l country. xitter.cf/balper/status/82686879…

32% of people in the U.S. believe it is very important to be Christian to be considered truly American pewrsr.ch/2jwRqvk
