

Quantitative market research / Data-driven Analysis. Historical stats support a thesis - they don’t replace one. Not investment advice. DYOR.
Germany
Joined May 2024
- Tweets663
- Following83
- Followers1.7K
- Likes966


HB Research retweeted
Pretty solid: On the 12 previous days when the QQQ/LQD RSI(14) was at or below 25.5, QQQ was higher one week later in 11 cases (92%). It was higher after both 9 and 12 months in all 12 cases.
Small sample, with some overlapping observations.
LQD is the "iShares iBoxx $ Investment Grade Corporate Bond ETF"


Not even during the pandemic did this ratio reach such extreme levels.
This suggests potential short-term relief and a positive bias for the month ahead.
This setup has occurred only 12 times since August 2002 (unfortunately, LQD wasn't listed during most of the dot-com bear market).
The average 1-month return was +5.08% for QQQ, with positive returns in 9 out of 12 occurrences.

HB Research retweeted
Asset managers’ net positioning in VIX futures hit a record low in October, measured as a share of open interest. It has since recovered but remains historically short.

HB Research retweeted
The equity put/call ratio reached 1.05 today, its highest reading since April 17, 2024.
The charts start in June 2012, when Cboe began excluding ETF and other ETP options from its equity series. A 20-trading-day cooldown limits repeated counting of clustered signals.
(SPX version in comments)

HB Research retweeted
The S&P 500 fell 4.35% today, a move seen on 42 prior days since 1970, mostly during crises. Their median 12M return was +24.7%, versus +11.3% for a typical SPX day 12M return. A large historical gap, though the signals overlap and the result does not survive adjustment across 10 horizons.

HB Research retweeted
VIX spiked >69% intraday vs. yesterday’s close, only the 6th time since 2004. The last three: Dec ’24’s Fed selloff, Aug ’24’s yen carry unwind, and 2018’s Volmageddon.

HB Research retweeted
VXN spiked 53% intraday today. After 12 prior ≥40% spikes since Sep 2003, NDX was higher 12M later every time; 83% were up after 1M. Capitulation low or different this time?
Market still open: VXN may rise. 45%/50% charts in comments (smaller samples). Dot-com bust not covered.

HB Research retweeted
Since 1987, the Nasdaq 100 has opened at least 2.5% lower while still above its 200-day moving average on 14 occasions.
small sample

HB Research retweeted

20% of S&P 500 stocks above the 50 day moving average also occurred in December 2024, 2 months before a major top. Out of the 2 cases, the current case is more similar to December 2024 than to March 2026 because of the minimal decline in SPX price.
xitter.cf/RyanDetrick/status/210…


HB Research retweeted
One month later, the S&P 500 was higher in 30 of 36 historical cases (83%), with an average gain of 2.7%.
Not a long-term bullish signal!

HB Research retweeted
Only 25.4% of S&P 500 stocks are currently above their 50-day moving average.
That is unusually weak short-term breadth beneath an index still near all-time highs.

HB Research retweeted
Bond-market volatility is rising sharply.
The MOVE Index has surged 33% over the past two trading days.
(MOVE is inverted)

HB Research retweeted
The S&P 500 has historically performed well over both short and long horizons after RSP/XLK fell at least 4.5% in five trading days.
Recent signals have clustered near all-time highs, even with a 21-trading-day cooldown.

HB Research retweeted

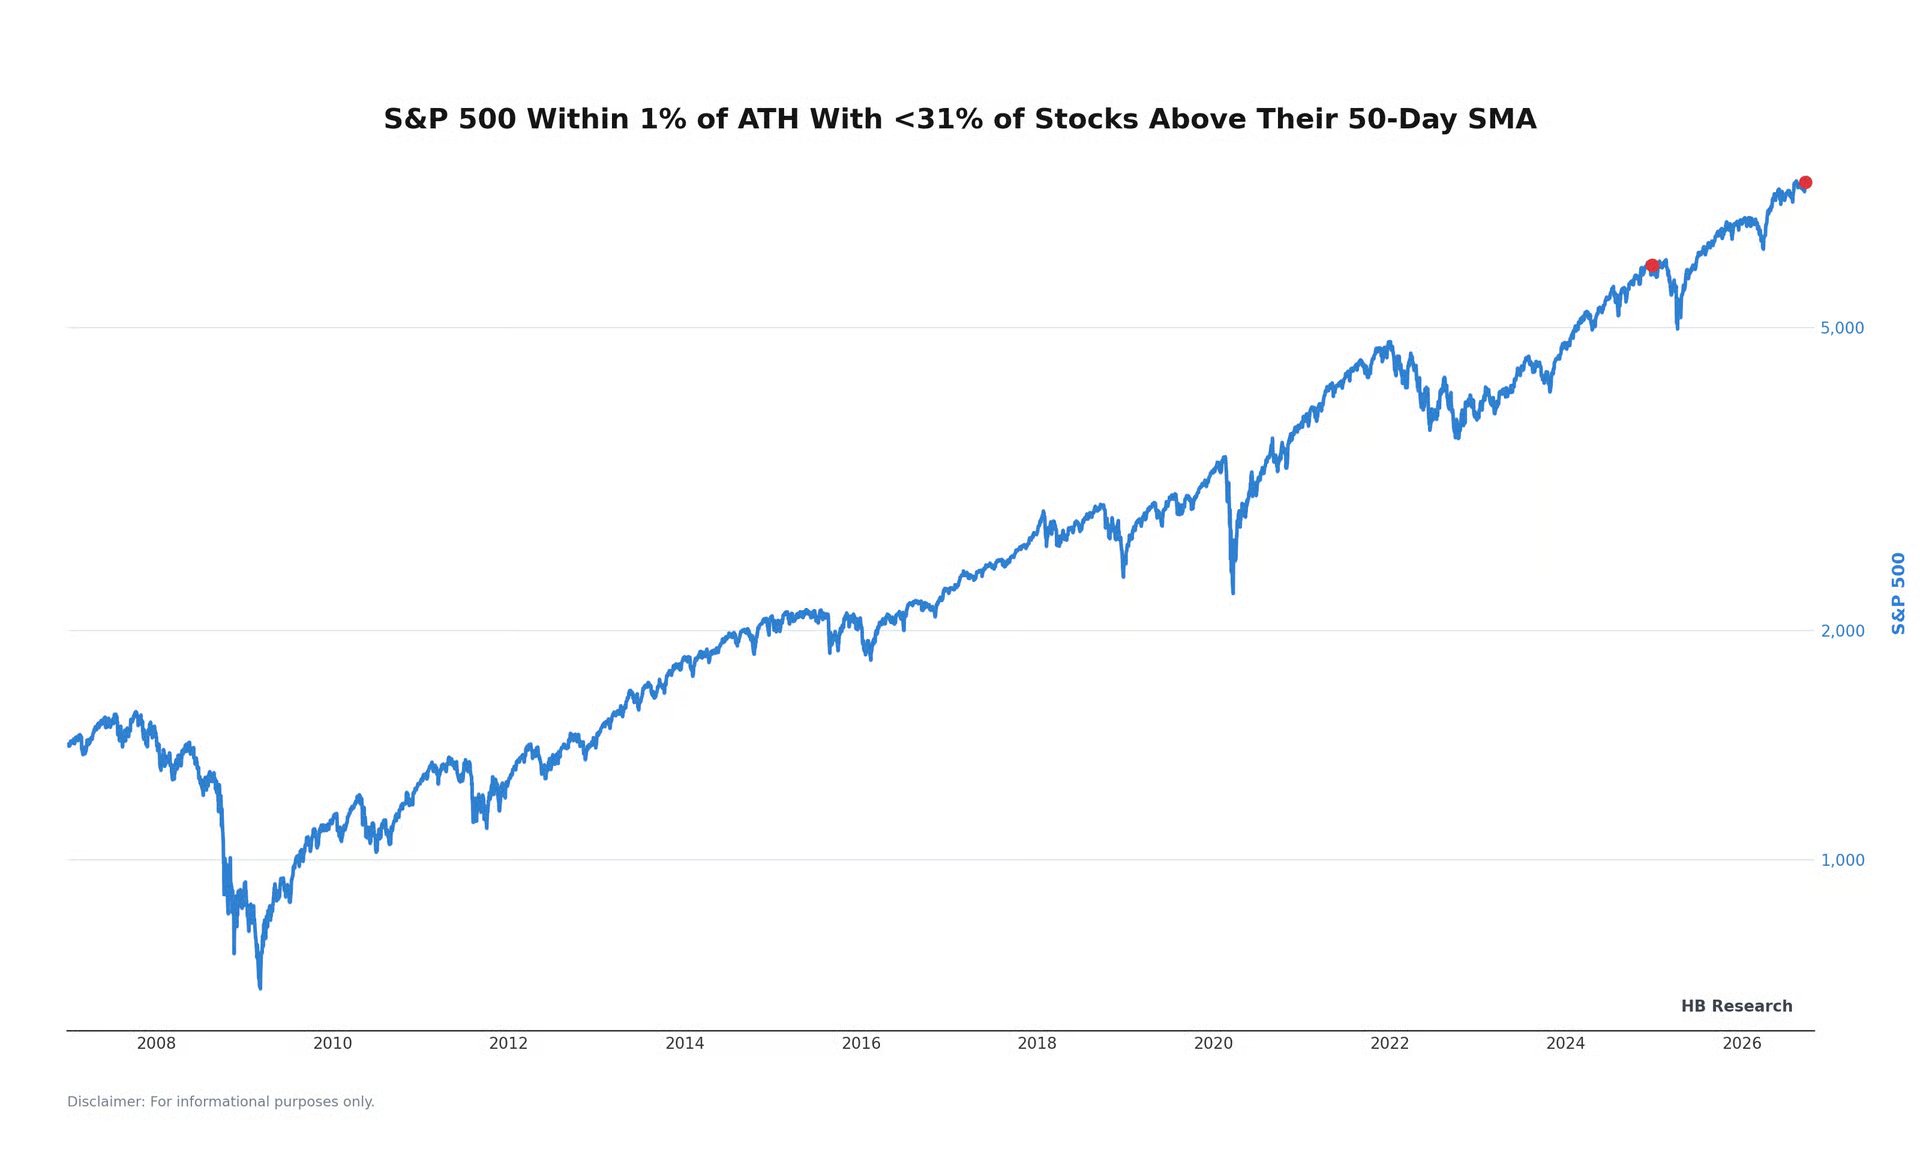
"Breadth looks unusual. The S&P 500 is within 1% of its all-time high, yet fewer than 31% of its stocks are above their 50-day SMA. Since late 2006, this has occurred on only two prior trading days, both in December 2024."
@HBResearchX
HB Research retweeted
Unusual breadth: More S&P 500 stocks have hit new 52-week lows than highs for over 6 straight sessions, despite the index being near ATH.
After the sixth day, short-term returns were mixed. At 6 and 12 months, 16/17 cases were positive, averaging +11.2% and +21.3%.

HB Research retweeted
Yesterday, Meta posted its 11th-biggest daily gain: +11.34%.
Similar jumps saw positive returns in 9/10 cases after both 2 and 6 months, and 10/10 after 12 months.
April 2022 was the only loser at both 2 and 6 months.

HB Research retweeted
Breadth looks unusual.
The S&P 500 is within 1% of its all-time high, yet fewer than 31% of its stocks are above their 50-day SMA.
Since late 2006, this has occurred on only two prior trading days, both in December 2024.

HB Research retweeted
Bitcoin’s 252-day return is currently -5.82%.
Yet price is still 25.37% above its 100-day moving average.
Historically, this combination appeared in the early stages of Bitcoin’s past three major bull-market cycles.

HB Research retweeted
NDX has risen 4.93% over the last 3 trading days, while 20-day realized volatility remains below 20%.
Historically, similar setups have been quite bullish over the long run.
In every completed historical instance, 12-month forward returns were positive.

HB Research retweeted
Large speculators increased their net long positioning in the latest CFTC report.
Still, positioning remains well below the levels seen around Bitcoin’s local bottom a few months ago.


