

The open-source observability database. One columnar engine for metrics, logs & traces on object storage. SQL across signals. PromQL for metrics.
- Tweets928
- Following197
- Followers1K
- Likes557






ALT GreptimeDB v1.1.0 is out, a production-focused release after the v1.0 GA


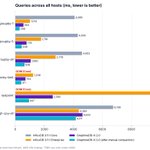
ALT Horizontal bar chart of query latency in milliseconds, lower is better, for six TSBS query types across all 4,000 hosts. Values for InfluxDB 3.11.1 Core, InfluxDB 3.11.1 Enterprise, GreptimeDB v1.2.0, and GreptimeDB v1.2.0 after manual compaction: double-groupby-1: 4,089 / 1,014 / 564 / 298. double-groupby-5: 4,309 / 1,781 / 776 / 446. double-groupby-all: 4,603 / 2,779 / 1,060 / 638. groupby-orderby-limit: Core out of memory / 1,236 / 704 / 411. lastpoint: Core out of memory / 9,347 / 2,585 / 947. high-cpu-all: 6,748 / 4,384 / 4,633 / 4,171. Test setup: AWS c5d.2xlarge, TSBS cpu-only, scale=4000.

ALT Horizontal bar chart of query latency in milliseconds, lower is better, for nine TSBS query types touching 1 or 8 hosts. Values for InfluxDB 3.11.1 Enterprise, GreptimeDB v1.2.0, and GreptimeDB v1.2.0 after manual compaction: cpu-max-all-1: 10.3 / 24.1 / 13.0. cpu-max-all-8: 19.9 / 54.5 / 31.8. high-cpu-1: 4.0 / 17.5 / 13.4. single-groupby-1-1-1: 3.6 / 7.5 / 5.9. single-groupby-1-1-12: 4.3 / 13.1 / 10.1. single-groupby-1-8-1: 5.9 / 16.6 / 10.7. single-groupby-5-1-1: 4.5 / 8.1 / 6.6. single-groupby-5-1-12: 5.8 / 13.8 / 11.5. single-groupby-5-8-1: 7.5 / 17.9 / 11.8. A note says InfluxDB 3 Core took 58 to 823 ms on these queries and is omitted from the chart. Test setup: AWS c5d.2xlarge, TSBS cpu-only, scale=4000.


ALT Card from the GreptimeDB blog on TopK dynamic filters. Headline: "Top 10 rows shouldn't cost a full scan." Query: SELECT * FROM langchain_traces ORDER BY end_time DESC LIMIT 10. Illustrative diagram of eight row groups labeled with their max end_time (97, 41, 88, 23, 65, 99, 12, 54). Before: the scan can't see TopK, there is no scan filter, and all 8 row groups are read and then sorted. Since v1.0: TopK's current 10th value becomes a dynamic scan filter that tightens as rows arrive, shown as end_time > 85; row groups with max 97, 88, and 99 are read and the other five are skipped, 3 of 8 read. Result: 28.9s to 0.21s for the same query on a trace table of about 5 to 6 billion rows. Source: GreptimeDB PR 7545, DataFusion dynamic filters. Footer: measured on v1.0, May 2026; gains depend on data layout and LIMIT.


ALT GreptimeDB v1.2 feature card for export-v2 / import-v2. Headline: "Interrupted migrations pick up where they stopped." Three steps: 01 Chunk by time (--chunk-time-window); 02 Job stops midway, progress kept in the snapshot; 03 Rerun the command, done chunks are skipped. Shell command with annotations: "greptime cli data export-v2 create" creates the snapshot, or resumes it if it exists; "--addr 127.0.0.1:4000" is the GreptimeDB HTTP endpoint; "--to s3://backup/prod-2026-06" is the snapshot location, which can also be oss://, gs://, azblob://, or file://; "--start-time 2026-06-01T00:00:00Z" and "--end-time 2026-07-01T00:00:00Z" set the bounded range that chunking needs; "--chunk-time-window 1d" makes one chunk per day; "--chunk-parallelism 8" runs 1 to 64 chunks at once; "--s3 --s3-region us-west-2" enables S3, with the bucket taken from the URI. Footer: import-v2 resumes too, via a state file. --force starts over.

ALT Card for GreptimeDB v1.3 query spill-to-disk, titled "Big queries spill to the disk you choose". A three-step flow: sort and aggregate operators buffer rows, the query hits the memory_pool_size limit, then data spills to disk at your chosen path and cap. Below, a config.toml [query] section with annotations: memory_pool_size = "4GB" (limit for query operators), experimental_spill_mode = "custom" (or "disabled" to turn off), experimental_spill_path = "/data/spill", experimental_spill_max_temp_directory_size = "50GiB", experimental_spill_compression = "zstd" (or lz4_frame, uncompressed), experimental_memory_pool_policy = "fair". Footer: experimental; memory_pool_size does not limit table scans yet.

