

A complete charting SDK and agentic API for building editable, story-driven data experiences inside your product.
Joined November 2018
- Tweets754
- Following302
- Followers3.4K
- Likes816





This week in Graphy’s SDK: new recipes for Sankey diagrams, Mekko charts and error bars, all available as plugins in beta.
Plus progress on our point and edit UI for changing chart types, layouts and styles.
Full update: graphy.dev/changelog/2026-10…


Halloween comes to Graphy’s charting SDK!
Get your data dressed up for spooky season with our new Halloween theme 🎃 👻🦇.
Preview and install it here, if you dare... graphy-themes-showcase.verce…

This week in Graphy’s charting SDK:
16 new themes, plus box plots, waterfalls and funnels, all in beta.
We’re also working on point and edit, with controls for colours, labels, legends and axes.
Read the full update: graphy.dev/changelog/2026-10…

New themes for Graphy’s charting SDK! 🎨
Give your charts some character, from Comic’s bold colours and playful lettering to Financial’s classic newspaper look.
Add them to your product as-is, or customise them with our Styling API. Have a play here: graphy-themes-showcase.verce…
There’s room to get more creative with the charts in your product.
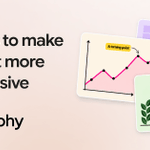
Here are 6 ways to make charts more expressive, from colour and annotations to custom shapes, with before-and-after examples built in Graphy.
graphy.dev/blog/expressive-c…
#datastorytelling #dataviz #productdesign

New Styling API! 🎨
Developers and agents can now control every styling detail in our charts, including fonts, colours, shapes and textures. Build out a brand kit for consistent on-brand charts, or give users full creative freedom over every element: graphy.dev/changelog/2026-09…
Big news: Graphy is now SOC 2 Type 2 compliant 🎉
Building with Graphy? Point your security team here to explore our controls and request our SOC 2 report:
trust.graphy.dev

A hint of what expressive charts can look like.
We’ve been exploring different ways to tell stories with data using v2 of our Charting SDK and skill. Here’s a scroll through our gallery of current experiments: graphy.dev/charts
#datavisualization #charts #skill #dataviz
We've spent years helping people turn data into stories. Now we're putting that experience in your hands.
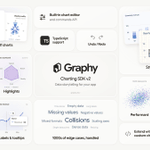
Introducing v2 of Graphy's Charting SDK: expressive visualisations, custom styling and storytelling tools for the products you build.
🔗 graphy.dev/blog/announcing-v…

We wanted to know if Graphy can run DOOM. Turns out that with creative use of our heatmap visualisation, the answer is 'yes it can'!
Each frame is an individual heatmap made from 36,000 data points, redrawn quickly enough to play. Goodbye Friday... doom-graphy.vercel.app/
Here's the full writeup explaining how @Jaume_uep did it, plus a link to the source code graphy.dev/blog/can-graphy-r…

Graphy.dev now has a changelog 🙌
This week we’ve focused on how graphs load, handle arriving data and respond to your pointer. We're also much closer to completing our Styling API, and we've shipped 15 other fixes and improvments to the SDK graphy.dev/changelog/2026-09…


Graphy retweeted

It’s a hackathon week at @GraphyHQ🤘 lots of cool ideas, great vibes, and big ambitions.


We’ve all spent too long getting charts “just right” for slides, tweaking layouts, fixing labels, adjusting colours, all to make something presentation-ready.
Smart Charts is a big step toward reducing that design tax.