

A stock ticker for hurricane risks around the world.
- Tweets1.9K
- Following1
- Followers6.1K
- Likes2
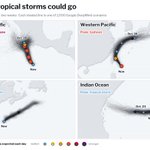


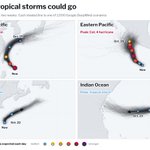


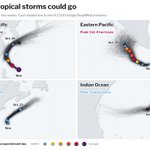

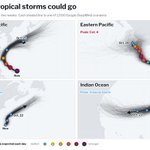

ALT Map panels, one per active tropical storm, showing where each could go over the next two weeks. A black arrow marks the median forecast track, with one dot per day sized and colored by wind strength. Gray lines show the individual Google DeepMind ensemble scenarios and fan out where the forecast is least certain.

ALT Map panels, one per active tropical storm, showing where each could go over the next two weeks. A black arrow marks the median forecast track, with one dot per day sized and colored by wind strength. Gray lines show the individual Google DeepMind ensemble scenarios and fan out where the forecast is least certain.

ALT Map panels, one per active tropical storm, showing where each could go over the next two weeks. A black arrow marks the median forecast track, with one dot per day sized and colored by wind strength. Gray lines show the individual Google DeepMind ensemble scenarios and fan out where the forecast is least certain.

ALT Map panels, one per active tropical storm, showing where each could go over the next two weeks. A black arrow marks the median forecast track, with one dot per day sized and colored by wind strength. Gray lines show the individual Google DeepMind ensemble scenarios and fan out where the forecast is least certain.

ALT Map panels, one per active tropical storm, showing where each could go over the next two weeks. A black arrow marks the median forecast track, with one dot per day sized and colored by wind strength. Gray lines show the individual Google DeepMind ensemble scenarios and fan out where the forecast is least certain.

ALT Map panels, one per active tropical storm, showing where each could go over the next two weeks. A black arrow marks the median forecast track, with one dot per day sized and colored by wind strength. Gray lines show the individual Google DeepMind ensemble scenarios and fan out where the forecast is least certain.

ALT Map panels, one per active tropical storm, showing where each could go over the next two weeks. A black arrow marks the median forecast track, with one dot per day sized and colored by wind strength. Gray lines show the individual Google DeepMind ensemble scenarios and fan out where the forecast is least certain.

ALT Map panels, one per active tropical storm, showing where each could go over the next two weeks. A black arrow marks the median forecast track, with one dot per day sized and colored by wind strength. Gray lines show the individual Google DeepMind ensemble scenarios and fan out where the forecast is least certain.

ALT Map panels, one per active tropical storm, showing where each could go over the next two weeks. A black arrow marks the median forecast track, with one dot per day sized and colored by wind strength. Gray lines show the individual Google DeepMind ensemble scenarios and fan out where the forecast is least certain.

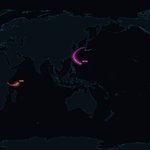
ALT Global ensemble forecast tracks for named tropical cyclones. Each basin uses a different neon color; brighter areas show greater agreement among forecast members.