

Custodian of CODEXVII. ENIGMA | TIME THEORY | QUATERLY CYCLES
Joined January 2026
- Tweets2.7K
- Following44
- Followers3K
- Likes3.6K



Pinned Tweet
How to Identify ENIGMA Levels. youtu.be/Ibwi3d3BGDw?si=-wiD… via @YouTube

The only thing lacking in you trading career is ENIGMA.

A new chapter in trading history starts now.
Enigma: a strategy built to rethink how markets are traded.
The reveal is coming. Be early.
#Enigma
ENIGMA - CODEXVII will be the last staretgy you will ever learn.
Rome was not Built in day.
A new chapter in trading history starts now.
Enigma: a strategy built to rethink how markets are traded.
The reveal is coming. Be early.
#Enigma
A new chapter in trading history starts now.
Enigma: a strategy built to rethink how markets are traded.
The reveal is coming. Be early.
#Enigma
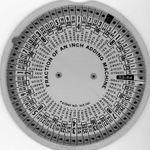
What if an old mechanical calculator held a clue to a new way of studying markets?
ENIGMA | Decoding Price & Time
The “Fraction of an Inch Adding Machine” transforms numerical relationships into a circular system.
ENIGMA explores a similar idea in trading: mapping price increments, time intervals and potential confluence zones to identify patterns worth investigating.
The goal is to test the relationships against historical market data—not assume they predict the future.

Markets move in price, but they also unfold through time.
Could angular relationships, cyclical intervals and geometric proportions help identify potential market turning points?
The approach is simple: map the cycle, observe price behaviour, and validate every signal against historical data.
No assumptions. Only tested patterns.
The pyramid diagram explores π, geometric proportions, circles and angular relationships.
In trading, these concepts can inspire research into time cycles and potential turning points—but only historical backtesting can establish whether they offer an edge.
Geometry creates the hypothesis. Price data delivers the verdict.
Markets may appear chaotic, but time leaves patterns worth investigating.
With TIME ENIGMA, the focus shifts from chasing price to studying when a potential move may emerge.
No prediction without evidence. No entry without confirmation.
The clock sets the question. Price delivers the answer.
TIME ENIGMA — a different way to study Forex markets.
What if time is more than a clock, but a pattern of repeating cycles?
Inspired by symmetry, fractal geometry and recurring time intervals, TIME ENIGMA explores potential market turning windows — where time meets price.
No predictions without confirmation. Just cycles, structure and disciplined testing.
The market moves in price. The enigma lies in time.
Lets decode ENIGMA now⏳
t.me/ghostexecutions/148

What if the calendar is more than just dates?
Gann studied time through 360° divisions, while Fibonacci analysis tracks intervals such as 55, 89, 144 and 233.
When multiple time cycles converge, traders watch for potential turning points.
ENIGMA explores the timing. Price action must confirm the signal.
where price meets geometry.
55° • 90° • 144°
Three angles. One price structure. A hidden relationship between market swings, compression and potential breakouts.
The chart reveals the setup. Price reveals the outcome.
ENIGMA: Decode the structure. Anticipate the move.
How to Mark the Enigma Angles
Identify the major swing low.
Draw the 144° primary rising structure.
Mark the major swing high.
Draw the 55° descending resistance.
Mark the 90° intermediate structure.
Identify the convergence zone.
Wait for a confirmed breakout or breakdown.
Three angles. One structure. One potential opportunity.
#ENIGMA — Decode the structure. Anticipate the move.
What if the market’s chaos follows a structure most traders never look for?
2/3 ratio. 27. 108. 243.
Numbers that form a geometric pattern — but could they help us study the rhythm of price and time?
The chart shows the movement.
Mathematics may offer another lens.
The enigma isn’t predicting every move. It’s discovering what others overlook.
Markets move in price. But beneath the movement lies a mathematical enigma.
2/3. 9. 27. 108. 243.
Coincidence, geometry, or a hidden rhythm in market cycles?
The real question isn’t whether the pattern exists. It’s whether price reveals it before the crowd notices.
Study the structure. Decode the rhythm. Let the chart speak.
#TradingEnigma #MarketCycles
In trading, patterns are clues—not guarantees.
Observe. Decode. Validate.
ENIGMA: Mathematics Behind the Hidden Patterns
1, 2, 3, 5, 8, 13, 21…
Each number emerges from the sum of the previous two, creating the Fibonacci sequence.
But the real enigma is how mathematical patterns appear across nature, geometry, and financial markets.


Every planet follows an orbit. Every cycle leaves a trace. And the market?
It moves through rhythms that most traders notice only after they unfold.
Perhaps the real Enigma is learning to recognise the pattern before the crowd sees it.
The stars may inspire the theory, but price action must confirm the trade.
The next alignment may be closer than it appears.
The Enigma of the markets lies where mathematics meets the mysteries of the universe.
Like planets aligning under the laws of astrology, price levels form hidden geometries. Perhaps the market leaves clues in its cycles, waiting for the patient trader to decode them.
Is it coincidence, cosmic rhythm, or a pattern yet to be understood?
Observe the alignment. Decode the pattern. Respect the risk.
The secret isn't the circle.
It’s the interval.
When multiple time cycles begin to converge, volatility often follows.
Mark the window.
Wait for liquidity to be taken.
Then let price reveal the direction.
ENIGMA is not about predicting the move.
It’s about knowing when to watch. ⏳