



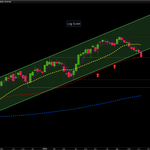


$MU I was not paying attention to this name lately. Fake breakout and wild breakdown? Yikes!!! Crazy market! Weekly chart updated

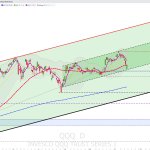
$MU What a super bullish megaphone! Plus that ascending triangle fully formed at this point. In case of breakout then the theoretical max projection aims to new ATH around $1500. 😲

$NVAX Shitty weekly candle + rejection at 61.80% fibo retracement. That support #3 will be around $11.00 next week. Better for bulls if that level holds ( give or take ). Plus bearish crossdown on weekly stochastic. ... GL guys ...

$NVAX Early weekly chart just to show how the week started ... but what really matters is how the week ends. For a serious technical move the price should respect any re-test of the long term resistance #1 and turn into support. Otherwise this would be another pump&dump. GLTA


$IWM Weekly chart so far. Channel updated. Nice bounce at SMA50 + that prior resistance turned into support held again. I would love to see a larger lower wick for EOW and then we talk, ok? 🙏


$ASTS Short term speaking, a technical bounce is overdue at this point ... but at this rate of -10% per day... waiting for today, tomorrow, or the day after, it could cost you a fortune ...
2-day candles chart + RSI backtesting. 🧐


$ASTS The target after the box breakdown was completed already. Now let's see what happens with the other pending issue, the HS pattern breakdown. 2-day candles chart updated.

$LTBR ... and one year after ... here we are ... -82% dragdown and no sign of bottom yet ... Monthly chart updated


$USAR Daily RSI at 24, very oversold. It's the lowest level in the last 3 years at least. What a falling knife, huh? Better for the remain bulls if the range 11.45-11.72 holds. 🙏 This is the early weekly chart so far. We need a large lower wick for EOW!

$VZ That weekly signal has worked nicely in the past. I'd wait for it. Weekly chart.

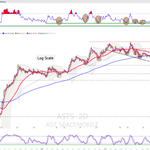
$ASTS I’m going to share this long-term channel breakdown. A relief bounce is likely in the coming days, with a retest of all the horizontal support levels lost this week; let’s see what happens then. Don't blame if I'm cautious right now. See you next weekend. GLTA
