

Drive your investment success with intelligent analytics.
London, England
Joined May 2017
- Tweets2.3K
- Following261
- Followers3.4K
- Likes859
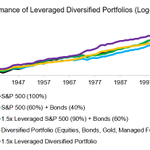



100% Equities vs Leveraged Diversified Portfolios: A 100-Year Perspective. Does diversification plus leverage beat an all-equity portfolio?
insights.finominal.com/resea…

281
Portfolio Review: Russell Investments' Core Growth Model Portfolio. What is the investment strategy?
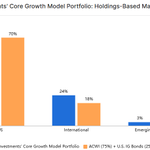
Provide a growth-oriented portfolio dominated by global equities (75%), with diversification into bonds, real estate, and alternatives. Russell Investments strongly believes in active management and is dedicated to manager research.
What are the holdings? The portfolio comprises 11 funds from Russell Investments, with the largest allocation to the Russell Investments US Strategic Equity Fund (RUSTX, 27%), followed by Russell Investments Global Equity Fund (RGDTX, 25%), and Russell Investments International Developed Mkt (RNTTX, 11%). RMHTX (5%) was only launched in 2024, so we replaced it with a similar fund (LDRAX) to extend the portfolio's history. The portfolio is expensive at a 0.75% pa.
finominal.com/portfolio-anal…

1
205
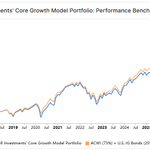
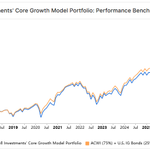
How has the portfolio performed? We use a benchmark of the MSCI ACWI Index (75%) and U.S. Investment-Grade Bonds (25%), and Russell's model portfolio has underperformed it since 2017. We can only show the performance of the current holdings, as Russell does not disclose the actual track record, but from experience, realized returns tend to be worse.
finominal.com/portfolio-anal…

1
43
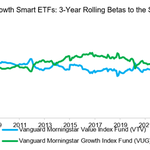
The Impact of Market Beta on Smart Beta Performance.
Does it matter?
insights.finominal.com/resea…

174
Product Review: Sector Rotation Funds (FV, XLSR, SECT, SSUS, AESR, NAVFX). What's the strategy?
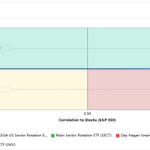
We select U.S. sector rotation funds with at least 5 years of track record, namely the First Trust Dorsey Wright Focus 5 ETF (FV), State Street SPDR SSGA US Sector Rotation ETF (XLSR), Main Sector Rotation ETF (SECT), Day Hagan Smart Sector ETF (SSUS), Anfield US Equity Sector Rotation ETF (AESR), and Navigator Sector Rotation Fund (NAVFX). They charge management fees between 0.30% (FV) and 1.91% (NAVFX), and collectively manage $9bn.
FV, XLSR, and SECT are always 100% invested in equities, while SSUS, AESR, and NAVFX are tactical and can move to cash & equivalents. All aim to outperform the U.S. stock market primarily through sector rotations, although strategies differ. Currently, they are all close to 100% allocated to U.S. equities.
finominal.com/asset-comparer…

1
240
What's the overlap in holdings? An overlap analysis highlights that the Select Sector SPDR Trust - Technology Select Sector SPDR Fund (XLK) is the largest allocation in three of the funds, which is perhaps expected given the strong performance of technology stocks. Other overlaps are in industrial, financial, and healthcare stocks.
finominal.com/asset-comparer…

1
53
Fund Selection: Equity Substitutes vs Diversifiers.
What funds are worth buying?
insights.finominal.com/resea…

265
Portfolio Review: The Cockroach Portfolio. What is the investment strategy? We're analyzing a portfolio based on the investment philosophy of the Cockroach Fund run by Mutiny Funds. RCM Alternatives described the portfolio construction as comprising equal allocations to global equities, global bonds, long volatility, and trend-following strategies, with a dash of gold and crypto. The article was published in 2021, so we have five years of out-of-sample performance.
rcmalternatives.com/2021/09/…

1
1
270
What are the holdings? We use the MSCI ACWI Index for global equities (ACWI, 25%), the Bloomberg Global Aggregate Bond Index (GBIUX, 25%) for global bonds, the AQR Managed Futures Strategy Fund (AQMIX, 25%) for trend following strategies, SPDR Gold Shares (GLD, 2.5%) for gold, and the Grayscale Bitcoin Trust ETF (GBTC, 2.5%) for cryptocurrencies. There are no publicly traded funds that are great proxies for long volatility strategies, so we use the Cambria Tail Risk ETF (TAIL, 10%) and AGF US Market Neutral Anti-Beta Fund (BTAL, 10%) for this. The total portfolio cost is 0.67% pa, which is moderately cheap for such a diversified portfolio.
finominal.com/portfolio-anal…

1
147
Bonds vs Gold vs Managed Futures: A 25-Year Perspective. Rethinking traditional asset allocation.
insights.finominal.com/resea…

2
246
Product Review: Momentum vs Growth ETFs (SPMO vs VUG). What's the strategy & portfolio composition?
On Bloomberg or CNBC, talk show hosts often use momentum and growth stocks interchangeably, but they are two distinct strategies. We use the Invesco S&P 500 Momentum ETF (SPMO) and the Vanguard Growth ETF (VUG) as case studies. SPMO selects the top 100 momentum stocks from the S&P 500, and scales the score by volatility to identify consistent outperformers. VUG selects large-cap stocks based on expected and historical EPS & sales growth, along with two quality metrics. SPMO holds roughly 100 stocks and charges 0.13% pa, compared to 150 stocks and 0.04% for VUG.
finominal.com/asset-comparer…

1
1
300
An overlap analysis with the S&P 500 shows that SPMO has a lower overlap of 36% than VUG, at 57%. The holdings differ notably; SPMO does not currently hold Apple, Microsoft, or Amazon, likely because they lack momentum characteristics.
finominal.com/asset-comparer…

1
55
Bonds vs Gold vs Managed Futures: A 100-Year Perspective. Rethinking traditional asset allocation.
insights.finominal.com/resea…

6
286
Portfolio Review: J.P. Morgan's Strategic 75-25 US ETF Model. What is the investment strategy? Provide a growth-oriented portfolio dominated by U.S. equities (75%), with only moderate fixed-income exposure (25%).
What are the holdings? The portfolio comprises 11 ETFs from J.P. Morgan, with the largest allocation to the JPMorgan BetaBuilders US Equity ETF (BBUS, 37%), followed by JPMorgan Active Growth ETF (JGRO, 15%), and JPMorgan Active Value ETF (JAVA, 15%). The portfolio is cheap at a 0.20% pa.
finominal.com/portfolio-anal…

1
296
How has the portfolio performed? One of the ETFs was launched only in 2023, so we have a short performance history. The current holdings have performed almost identically to its benchmark, a combination of the Russell 3000 (75%) and U.S. IG Bonds (25%). However, the factsheet shows the track record since 2021, where the model portfolio also generated identical performance to its benchmark. In other words, J.P. Morgan has not created value through its strategic asset allocation decisions.
finominal.com/portfolio-anal…

1
81

Product Review: Covered Call ETFs (JEPI, FTHI, PBP, DIVO). What's the strategy & portfolio composition?
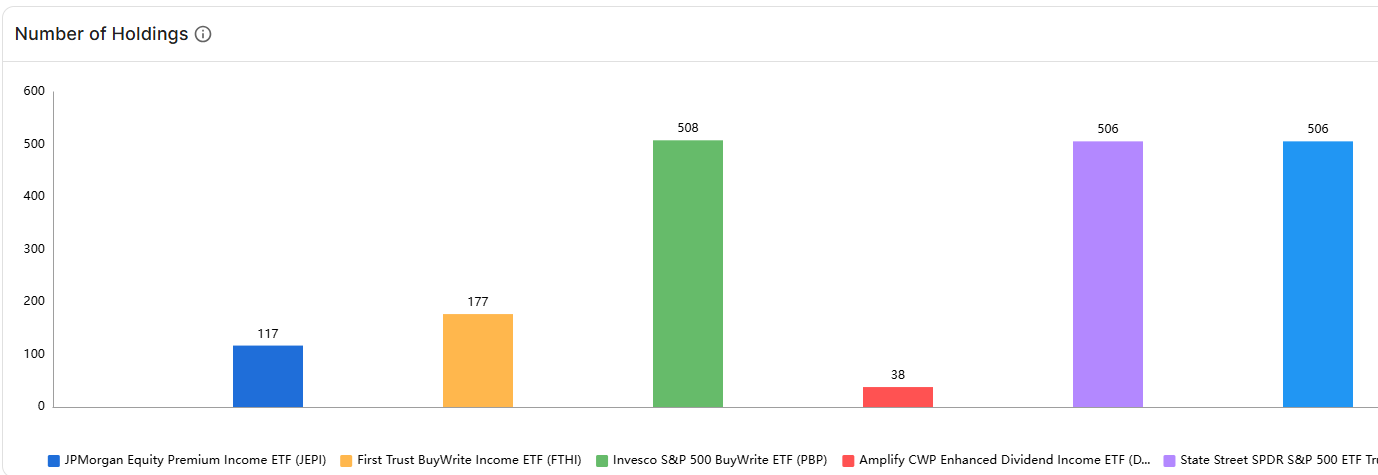
We select four U.S. ETFs that pursue covered call strategies, which typically means holding stocks and writing call options for income, resulting in reduced upside but a higher yield. These are the JPMorgan Equity Premium Income ETF (JEPI), First Trust BuyWrite Income ETF (FTHI), Invesco S&P 500 BuyWrite ETF (PBP), and Amplify CWP Enhanced Dividend Income ETF (DIVO). Fees range from 0.29% for PBP to 0.76% for FTHI. JEPI dominates with $46bn of AUM, followed by DIVO with $8bn. DIVO's portfolio is most concentrated with 38 stocks, while PBP is most diversified with 508 stocks.
finominal.com/asset-comparer…?
3
292
An overlap analysis with the S&P 500 shows a range from 35% for JEPI to 99% for PBP, which tracks the CBOE S&P 500 BuyWrite Index. The largest common holding is Apple (1.6% to 7.5%), followed by NVIDIA and Microsoft.
finominal.com/asset-comparer…

1
72
Multi-Factor Investing: Sequential Model.
Does the factor sequence matter?
insights.finominal.com/multi…

1
217
Portfolio Review: WisdomTree's US Factor Portfolio.
What is the investment strategy? WisdomTree selects smart beta ETFs to provide exposure to multiple equity factors. It's a 100% equity portfolio.
What are the holdings? The portfolio includes 8 ETFs, 6 of which are from WisdomTree. The largest allocation is to the Schwab US Large-Cap Growth ETF (SCHG, 30%), followed by the WisdomTree US LargeCap Fund (EPS, 20%), and the WisdomTree US Quality Dividend Growth Fund (DGRW, 20%). The portfolio is cheap, with 0.16% pa.
finominal.com/portfolio-anal…

1
4
321
How has the portfolio performed? The auto-suggested benchmark is the Russell 3000 Index, which the current portfolio has outperformed since 2017. It has also generated a higher Sharpe ratio (0.66 vs 0.61). However, this is not the actual record, which is available on the model portfolio's factsheet. This shows the strategy underperformed, with a gross CAGR of 12.25% compared to 14.45% for its benchmark index.
finominal.com/portfolio-anal…

1
75
Do AI and Machine Learning Funds Actually Outperform?
Evaluating AI & ML-focused U.S. Equity Funds.
insights.finominal.com/resea…

158
Product Review: Concentrated vs Diversified U.S. Value ETFs (PVAL, FLV, QVAL, DFAT, DFUV, VLU).
What's the difference in strategy? We select three concentrated U.S. value funds (Putnam Focused Large Cap Value ETF (PVAL), American Century Focused Large Cap Value ETF (FLV), and Alpha Architect US Quantitative Value ETF (QVAL)) and three highly diversified ones (DFA Dimensional US Targeted Value ETF (DFAT), DFA Dimensional US Marketwide Value ETF (DFUV), and State Street SPDR S&P 1500 Value TILT ETF (VLU)). The diversified funds have more than 1,000 holdings, compared to approximately 50 for the concentrated ones. Fees range from 0.12% (VLU) to 0.54% (PVAL).
finominal.com/asset-comparer…

1
338
Intuitively, diversified funds should overlap more with the Russell 3000 than concentrated ones, but that is not true. The DFA Dimensional US Targeted Value ETF (DFAT) has an overlap of only 5%, the second-lowest after the Alpha Architect US Quantitative Value ETF (QVAL) at 2.5%.
finominal.com/asset-comparer…

1
98
Long-Short vs Long-Only Factor Investing.
These are comparable, right?
insights.finominal.com/resea…

3
154
Portfolio Review: LPL's Alpha Focused Aggressive Growth Portfolio.
What is the investment strategy? The portfolio provides exposure to global equities via actively managed funds.
What are the holdings? The portfolio comprises 13 mutual funds from diverse asset managers. The largest allocation is to the Nomura Large Cap Growth Fund (IYGIX, 17%), followed by the Alger Capital Appreciation Institutional Fund (ACIZX, 16%), and the Dodge & Cox Stock Fund (DODGX, 16%). The portfolio is expensive at 0.74% pa.
finominal.com/portfolio-anal…

1
1
244
How has the portfolio performed? The auto-suggested benchmark is the MSCI ACWI Index, which the current portfolio has outperformed since 2017. It has also generated a higher Sharpe ratio (0.63 vs 0.58). However, this is not the actual record, which we do not have. Typically, the current holdings overstate returns as performance chasing occurs, ie recently outperforming funds are added.
finominal.com/portfolio-anal…

1
59
Factor Crash Risk: U.S. Momentum Factor.
Should investors be concerned about the recent strong factor performance?
insights.finominal.com/resea…

2
194
Product Review: JPMorgan's $4bn U.S. Large Cap Core Plus Fund (JLCAX). What is the fund's strategy and performance? JLCAX was launched in 2005 and aims to outperform U.S. large-cap stocks via a 130/30 long-short strategy. JPMorgan's research team selects stocks using long-term growth metrics and relative valuation. The fund is expensive at 0.95%, but has outperformed its benchmark since inception and generated a higher Sharpe ratio (0.52 vs 0.50).
finominal.com/fund-analyzer-…

3
3
466
However, almost all outperformance occurred between 2005 and 2009. There were no additional excess returns over the last 15 years.
finominal.com/fund-analyzer-…

1
1
53