

40+ years helping financial professionals stay ahead of market trends. We do not reply to DMs/comments. For support, visit https://xitter.cf/t.co/nXEDyR00YV.
- Tweets26.1K
- Following291
- Followers122K
- Likes3.2K






ALT A screenshot displays an analysis of Nike's competitors based on geographic revenue diversification. The top section describes the analysis intent, mentioning Nike. Below, there is a table comparing several companies, including Nike, PUMA, and VF Corp, with color-coded bars showing revenue distribution across regions. A sidebar on the right provides further details or instructions.

ALT The image features a light blue background with abstract, wavy shapes on the left in shades of blue, gray, and white. Text on the right reads "S&P 500 Earnings Season Update: October 16, 2026." The bottom right corner displays the logo for Article Audio.


ALT A text graphic with a wave-like design on the left in blue, black, and white. The text reads: "Convincing Is Not the Same as Accurate: What Financial Institutions Must Demand from AI." In the bottom right corner, there is a logo for Article Audio.

ALT Dashboard view of Cobalt's investment portal displaying details for Knight Communications. The top section includes company description, investment details, and metrics like Total Invested and TTM Revenue. The bottom half shows two charts: YOY Revenue Growth % and Net Debt/LTM EBITDA. The sidebar contains navigation options like My Portfolio and Reports.


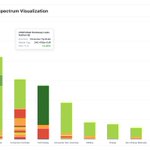
ALT Bar chart titled "Index Constituents Spectrum Visualization" displaying various sectors. The sectors are listed as Finance, Industrials, Consumer Cyclicals, Technology, Consumer Non-Cyclicals, Utilities, Energy, Non-Energy Materials, Healthcare, and Telecommunications. Bars vary in height and color, with a highlighted section for LVMH Moët Hennessy Louis Vuitton SE under Consumer Cyclicals, showing a market cap of 428.45 billion EUR.

ALT The image features a light blue background with abstract, wavy shapes on the left in shades of blue, gray, and white. Text on the right reads "S&P 500 Earnings Season Update: October 16, 2026." The bottom right corner displays the logo for Article Audio.


ALT FactSet Insight webpage featuring text about "The Rise of Conversational Portfolio Construction." The page discusses changes in portfolio construction approaches, highlighting richer objectives and sophisticated investment tools. A person's name, Georgi Mitov, is mentioned at the bottom.


ALT A text graphic with a wave-like design on the left in blue, black, and white. The text reads: "Convincing Is Not the Same as Accurate: What Financial Institutions Must Demand from AI." In the bottom right corner, there is a logo for Article Audio.