

Tech Talk is a free stock market letter service available at https://xitter.cf/t.co/BJV0N7vrq2 and https://xitter.cf/t.co/qBCl3egWXc. Ask us about the Seasonal Advantage Portfolio.
America
Joined December 2009
- Tweets14.2K
- Following424
- Followers10.1K
- Likes405




Pinned Tweet
Out now…
Our monthly report for October is available for download, providing insights, analysis, and trade ideas to navigate the market through the month(s)/year ahead.
Subscribe now to receive this 106-page report: charts.equityclock.com/subsc…
#Stocks #Bonds #Commodities #Gold

Traders leaning into defensive sectors as credit spreads balloon and as strength in high-beta segments fades. equityclock.com/2026/10/20/s… $XLV $XLRE $XLU

Scott Wapner @TheJudgeCNBC @CNBC: “Good luck finding the case there is a demand problem” pertaining to the AI buildout.
Certainly nothing definitive, or sustainable, yet, Information Processing Business Equipment Production, which has tracked the strength of the AI buildout pretty well since the spring of 2025, recorded a pronounced dip in September. Could be mid-term election hesitation or just mere end of quarter fluctuation as supply chain impacts cool the pace of expansion, but a datapoint has been provided to cue in on pertaining to the strength of demand. $SMH $XLK

One thing in the Industrial Production report that stood out was the abrupt September decline in Information Processing Business Equipment production. The category has been tracking the AI infrastructure buildout among businesses and this pullback, while just one month, certainly provides a tangible datapoint that backs the concerns the market is expressing pertaining to the AI trade. An above average trend persist three quarters of the way through the year, but the heat has definitely faded from what was observed earlier in the year. $XLK $SMH $DRAM


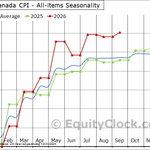
Canadian consumer inflationary pressures continue to run hot, fuelled by the high price of gas, various tariff pressures (eg. refrigerators), and the demand for AI infrastructure. CPI in Canada is up by 3.0% three-quarters into this year, firmly ahead of the 2.4% rise that is average for this timeframe. $STUDY $MACRO #CDNecon #CAD

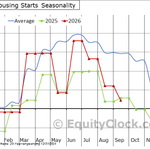
The high cost of borrowing continues to cripple the housing market, creating the weakest year-to-date change in housing starts since 2007 (the period leading into the Great Financial Crisis). US Housing starts are higher by a mere 4.4% through the first three quarters of 2026, significantly weaker than the 29.3% rise that is average for this timeframe. $STUDY $MACRO $ITB #Economy #Housing

Daily Market Update:
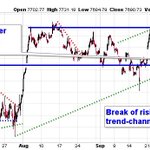
Traders bought into the tech weakness on Monday, lifting the growth sector and benchmarks heavy in this influence off of the floor from last week’s selloff. The S&P 500 Index recovered four-tenths of one percent, bouncing from the lower limit of the trading range that the benchmark has been in since August between 7620 and 7800. On Friday, the index broke below short-term rising trend channel support that had promoted the recent path of higher-highs and higher-lows in the past month. The benchmark is struggling around 20 and 50-day moving averages and the 100-day moving average remains a critical line in the sand. Weakening support raises concerns for the health of stocks moving forward. The market has reached the time of year when volatility starts to peak and roll over through the last couple of months of the year, thereby promoting strength in stocks, but the breakout in the VIX on Friday above declining trendline resistance provides the inkling that the instability that is leaching into the market may just be getting started.
$SPX $SPY
For trade ideas and ways to allocate your portfolio, subscribe to receive our daily reports: charts.equityclock.com/subsc…


Sentiment towards risk is clearly shifting. High beta $SPHB is carving out a double top pattern at 157. Performance relative to the market is breaking below rising trendline support from the past 18 months. When the market turns risk-off like this, it is typically appropriate to pay attention (and perhaps be at least a little cautious). $QQQ $SPY


Prices performing normally is one thing, but when they start to diverge from seasonal norms, that is when we really pay attention.
Crude oil prices climbing at a time of year when they typically pullback from the high demand summer driving season is something to be concerned by, particularly given its influence on the economy into the end of the year. $CL_F $USO $XLE #OIL

One thing in the Industrial Production report that stood out was the abrupt September decline in Information Processing Business Equipment production. The category has been tracking the AI infrastructure buildout among businesses and this pullback, while just one month, certainly provides a tangible datapoint that backs the concerns the market is expressing pertaining to the AI trade. An above average trend persist three quarters of the way through the year, but the heat has definitely faded from what was observed earlier in the year. $XLK $SMH $DRAM
The strength of the manufacturing economy continues to shine through the results of industrial production. US Industrial Production has increased by 2.6% (NSA) through the first three quarters of 2026, which is the strongest performance since 2018 and more than double the 1.1% increase that is average for this timeframe. $STUDY $MACRO $XLI #Economy #Manufacturing

Daily Market Update:
Stocks rebounded from yesterday’s selloff as the rotation in the market continues, presently away from Technology and into those segments that have been sold off since August amidst the rise in interest rates. The S&P 500 Index ended higher by a third of one percent, bouncing from short-term rising trend channel support that has promoted the recent path of higher-highs and higher-lows in the past month. After Wednesday’s decline, the benchmark remains below the upper limit of the range that it has been in since August between 7620 and 7800. The daily chart shows support at the 50 and 100-day moving averages, a violation of which would be required to deem a shift of trajectory. While beyond what has historically been the weakest two-week stretch of the year at the end of September, volatility in the market tends to remain heightened into the month of October, therefore caution has been appropriate, but we have been pushing back against the negativity that is typical for this timeframe (see our September 18th report). We continue to examine what may be the appropriate stance in equity positioning for the remainder of the month of October, but we have not received the cues to broadly de-risk in portfolios, yet (although we have been inclined to raise a little bit of cash).
$SPX $SPY
For trade ideas and ways to allocate your portfolio, subscribe to receive our daily reports: charts.equityclock.com/subsc…


Rates and the dollar pulling back from defined levels of resistance, allowing stocks to rally, but the prevailing headwinds have not been eliminated. equityclock.com/2026/10/15/s… $IEF $UUP #USDollar #Rates


CorWeave $CRWV, which has become the poster child to the AI buildout concerns, reversing precisely from horizontal support at $60 today. The stock has not been in demand by the market since May (as gauged by the performance relative to the market) and a breakdown would reflare the debt concerns that have gripped stocks in recent days. $SMH $XLK

The US Dollar is resisting exactly where we said it should, allowing risk assets to relax today following recent strains. However, the prevailing intermediate-term trend still suggests that this headwind hasn’t been eliminated. Seasonal tendencies remain positive for the Dollar into November. $UUP $SPY #USDOLLAR


While the change in consumer prices (CPI) is showing a bifurcation across the categories (discretionary segments struggling), the strength in Producer Prices (PPI) is broad, a testament to the heat the manufacturing economy is experiencing in 2026. PPI for Final Demand is up by 5.9% (NSA) through the first three quarters, more than double the 2.5% increase that is average for this timeframe. $STUDY $MACRO #Economy #Manufacturing #PPI
