

Big Tech, AI & Semis Investor — also quantum, nuclear, financials & more. Bull vs bear cases, earnings, moats. Substack 👇 Not financial advice. 🇬🇧
London,United Kingdom
Joined October 2025
- Tweets136K
- Following1.7K
- Followers2.3K
- Likes50K









Pinned Tweet
🚨 MICROSOFT $MSFT — DEEP DIVE
From Software Giant to AI Infrastructure Powerhouse
Microsoft is no longer just selling software.
It is building the foundation of the AI economy:
☁️ Azure
🤖 Copilot
🧠 AI Foundry
🏭 Data Centres
⚡ Custom Silicon
But the biggest question for investors:
Can Microsoft turn massive AI investment into durable, high-return growth?
I spent weeks analysing:
📊 Financial performance
☁️ Azure growth
🤖 AI ecosystem
🏗️ Infrastructure buildout
⚠️ Risks
📈 Long-term thesis
🧵👇
emmanuelinvest.substack.com/…
SUPERMICRO $SMCI: THE MARGIN IMPROVEMENT IS WHAT I'M WATCHING.
The revenue upgrade is impressive, but the improvement in profitability expectations caught my attention.
🔹 Revenue outlook: $18.5B–$19.5B
🔹 Gross margin outlook: 12.0%–12.5%, up from 10.4%–10.8%
For me, the bigger question isn't whether AI server demand is strong. It clearly is.
It's whether Supermicro can turn that demand into consistently better margins and cash flow.
The November 3 results will be an important test.
— EMMANUELINVEST

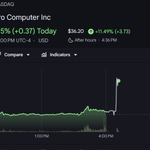
SUPERMICRO $SMCI SURGES 11.5% AFTER HOURS. THE AI REVENUE UPGRADE IS HUGE — BUT THE MARGIN IMPROVEMENT MAY MATTER EVEN MORE.
Supermicro closed at $32.47, then jumped to $36.20 after hours, following its preliminary Q1 FY2027 update.
And looking at the numbers, I can understand why investors are paying attention.
THE UPGRADE
🔹 Revenue: $18.5B–$19.5B
🔹 Previous Guidance: $14.5B–$15.5B
🔹 Consensus: Approximately $15.6B
🔹 Gross Margin: 12.0%–12.5%
🔹 Previous Margin Guidance: 10.4%–10.8%
At the midpoint, that's a $4B increase in expected quarterly revenue and a 165-basis-point improvement in gross margin.
But here's what stands out to me.
THE IMPLIED GROSS PROFIT INCREASE IS EVEN BIGGER
Under the previous guidance, midpoint revenue of $15B at a 10.6% gross margin implied approximately $1.59B in gross profit.
Under the new preliminary outlook, $19B at 12.25% implies approximately $2.33B.
That's roughly $738M more implied gross profit, or an increase of approximately 46%.
For a company operating in the highly competitive AI server market, that matters.
It suggests stronger demand is being accompanied by better expected gross profitability.
WHY I'M STILL WATCHING CASH FLOW
This is a preliminary, unaudited update.
We haven't yet seen the full picture on operating expenses, inventory, receivables or cash generation.
And those numbers matter enormously for a hardware business scaling this quickly.
Higher revenue doesn't automatically mean stronger free cash flow.
MY TAKE
The after-hours reaction is understandable.
Supermicro has delivered a substantial upgrade to both revenue and expected gross margin.
That's a stronger signal than revenue growth alone.
But the full earnings report on November 3 needs to confirm whether the improved gross economics are translating into operating profits and healthy cash conversion.
The AI demand is showing up in the numbers. Now I want to see how much of it becomes sustainable cash flow.
— EMMANUELINVEST

📅 WHAT I'M WATCHING TODAY — WEDNESDAY, OCTOBER 21
UK INFLATION COMES IN HOTTER. U.S. HOUSING WEAKENS. AI EARNINGS ARE NEXT.
Good morning.
We're starting Wednesday with another reminder that inflation, borrowing costs and corporate profitability remain closely connected.
UK inflation has surprised to the upside, U.S. housing data disappointed yesterday, and Asian semiconductor stocks are rebounding on encouraging AI earnings.
Later today, attention shifts to Meta $META, Tesla $TSLA and another busy corporate reporting session.
🇬🇧 UK — INFLATION RELEASED
🔹 Headline CPI: 3.5% vs 3.4% expected (3.1% previous)
🔹 Core CPI: 2.8% vs 2.7% expected (2.6% previous)
🔹 Monthly CPI: +0.4% vs +0.3% expected
🔹 Producer Input Prices: +8.3% YoY vs +7.2% expected
🔹 Public Sector Borrowing: £24.5B deficit vs £23.9B expected
The inflation figures are slightly hotter than expected, and producer input costs are accelerating.
Yesterday's labour-market figures also showed unemployment falling to 4.7%, below the 4.9% consensus.
My interpretation: Stronger employment is encouraging, but persistent price pressure could make it harder for the Bank of England to ease monetary policy.
🇺🇸 U.S. — HOUSING PRESSURE
Yesterday's data showed a sharp deterioration in housing activity.
🔹 Housing Starts: 1.221M vs 1.30M expected
🔹 Pending Home Sales: −7.3% vs −0.5% expected
🔹 Weekly ADP Employment Change: +18.5K vs +24.75K previously
The pending home sales decline particularly stands out.
Higher borrowing costs continue to weigh on affordability, even as other parts of the economy remain resilient.
TODAY'S U.S. DATA — UK TIME
12:00 PM — MORTGAGE APPLICATIONS
🔹 Previous 30-Year Mortgage Rate: 7.50%
🔹 Previous Applications Change: −2.7%
I'll be watching whether mortgage demand is stabilising.
3:30 PM — EIA OIL INVENTORIES
🔹 Crude Stocks: −0.3M expected vs −8.557M previously
🔹 Previous Gasoline Stocks Change: +3.518M
🔹 Previous Distillate Stocks Change: −2.527M
With Brent around $110, oil inventories matter for inflation expectations, energy costs and the broader cost of doing business.
🌏 ASIA + GLOBAL MARKETS
Asian semiconductor stocks are recovering following strong results from SpaceX $SPCX and Supermicro $SMCI.
🔹 South Korea's KOSPI: +3.7%
🔹 Taiwan's Taiex: +1.4%
🔹 Samsung: +7.1%
🔹 SK Hynix: +6.2%
But Australia's NextDC plunged around 40% after electricity-network delays pushed back data-centre capacity and revenue.
That's the AI infrastructure divide I'm watching: strong compute demand doesn't guarantee that every operator can deliver profitable capacity.
🇯🇵 JAPAN — TRADE DATA
🔹 Trade Deficit: ¥536.6B vs ¥181B expected
🔹 Exports: +16.7% YoY vs +20.1% expected
🔹 Imports: +18.9% YoY vs +19.6% expected
The wider-than-expected trade deficit and softer export growth show that the rebound in technology shares isn't necessarily reflecting strength across the wider economy.
📊 EARNINGS — BEFORE THE U.S. BELL
🔹 $ABT Abbott — Medical devices and organic growth
🔹 $T AT&T — Fibre, wireless and free cash flow
🔹 $NEE NextEra Energy — Electricity demand, grid investment and financing
🔹 $CME CME Group — Trading volumes and market volatility
🔹 $TMO Thermo Fisher — Life sciences demand and margins
🔹 $PM Philip Morris — Pricing and profitability
My focus here is $NEE.
AI infrastructure is creating significant electricity demand, but utilities still need to finance projects and earn attractive returns.
🌙 EARNINGS — AFTER THE U.S. CLOSE
🔹 $META Meta — AI capex, advertising growth, margins and free cash flow
🔹 $TSLA Tesla — Automotive margins, energy storage and AI investment
🔹 $IBM IBM — Software, AI bookings and consulting
🔹 $TXN Texas Instruments — Industrial semiconductor demand
🔹 $LRCX Lam Research — Semiconductor equipment and memory investment
🔹 $SAP SAP — Cloud growth, backlog and profitability
META — THE AI INVESTMENT TEST
Meta is one of my biggest earnings focuses today.
Its advertising business generates substantial cash, but the AI buildout requires enormous capital expenditure.
I'll be watching whether revenue and operating profit are growing fast enough to support that investment without putting increasing pressure on free cash flow.
TESLA — MARGINS AND EXECUTION
For Tesla, I'll be looking at automotive profitability, energy storage and management's plans for AI and robotics.
The bigger question is how these investments translate into commercial growth and shareholder returns.
🎯 MY MAIN FOCUS TODAY
🔹 UK inflation and the Bank of England outlook
🔹 U.S. mortgage demand and oil inventories
🔹 Asian semiconductor strength versus data-centre execution
🔹 $NEE — Power demand and infrastructure economics
🔹 $META — AI capex versus cash generation
🔹 $TSLA — Margins, energy and AI investment
🔹 $LRCX $TXN — Semiconductor demand and capital spending
MY TAKE
Today's developments highlight a tension across markets.
Inflation remains stubborn in the UK. U.S. housing is struggling with borrowing costs. Meanwhile, AI investment and semiconductor demand remain strong.
For investors, the question isn't simply which companies are growing.
It's which companies can turn that growth into sustainable profitability despite elevated energy, infrastructure and financing costs.
Capital → Power → Compute → Utilisation → Revenue → Cash Flow → Returns
Strong demand creates the opportunity. Execution, margins and cash generation determine the investment outcome.
That's what I'm watching today.
— EMMANUELINVEST
ASIAN STOCKS ARE REBOUNDING. BUT THE AI TRADE IS SHOWING AN IMPORTANT DIVIDE.
Asian technology stocks are recovering after strong results from SpaceX $SPCX and Supermicro $SMCI helped restore confidence in AI infrastructure demand.
THE MARKET REBOUND
🔹 South Korea's KOSPI: +3.7%
🔹 Taiwan's Taiex: +1.4%
🔹 MSCI Asia Pacific: +1.1%
🔹 Japan's Nikkei 225: Above +1%
Semiconductors are leading the recovery.
🔹 Samsung: +7.1%
🔹 SK Hynix: +6.2%
🔹 Kioxia: +3.2%
🔹 TSMC: +0.8%
The optimism makes sense.
Supermicro raised its preliminary quarterly revenue outlook to $18.5B–$19.5B, while SpaceX reported 161% revenue growth, supported by its expanding AI business.
That reinforces the strength of demand for AI computing infrastructure.
BUT HERE'S WHAT CAUGHT MY ATTENTION.
While semiconductor stocks are rallying, Australia's NextDC plunged around 40% after cutting its outlook because electricity-network delays pushed back data-centre capacity and revenue.
That's a significant contrast.
Demand for AI compute can be strong while the infrastructure needed to deliver it falls behind.
You can have customers ready to spend and GPUs ready to deploy.
But if power connections are delayed, revenue gets pushed back while construction and financing costs continue.
And with Brent crude above $110, higher energy costs and inflation remain additional risks.
MY TAKE
I'm encouraged by the rebound, particularly across memory and semiconductor stocks.
But one strong session doesn't mean the financing and execution concerns surrounding AI infrastructure have disappeared.
Chipmakers are benefiting from strong demand. Data-centre operators still have to secure power, deliver capacity and justify their investment.
And that's where I think the next phase of the AI trade gets interesting.
Strong AI demand is one thing. Turning it into profitable, operational capacity is another.
— EMMANUELINVEST
ELON MUSK IS PROJECTING $500 BILLION TO $1 TRILLION IN ANNUAL RECURRING REVENUE FOR SPACEX $SPCX BY THE END OF 2027.
That's an extraordinary ambition.
And after SpaceX's Q3 earnings, I'm beginning to see more clearly how Musk wants to build the business around Super Intelligence.
But there's a big difference between building AI infrastructure and generating enough profitable demand to justify it.
THE $1 TRILLION AMBITION
Musk believes SpaceX could reach $500B–$1T in annual recurring revenue by the end of 2027.
He also says Grok Bot is experiencing exceptionally rapid growth and could eventually consume most of the company's Super Intelligence compute capacity.
That tells me something important.
SpaceX isn't just building AI infrastructure to rent out computing power. It also wants to develop AI products capable of generating recurring revenue directly.
WHAT THE Q3 NUMBERS SHOW
🔹 Total Revenue: $14.58B, +161% YoY
🔹 Super Intelligence Revenue: $7.56B, +830%
🔹 SI Operating Income: $431M, versus a $1.72B loss last year
🔹 SI Adjusted EBITDA: $4.95B
🔹 Total Capital Expenditure: $19.59B
🔹 SI Capital Expenditure: $16.44B
Super Intelligence already accounts for approximately 52% of quarterly revenue.
But here's the part that interests me most.
SI generated $431M in operating income while absorbing $16.44B in quarterly capital expenditure.
Those aren't directly comparable measures of investment returns, but they show how much capital SpaceX is committing to this opportunity.
THE COMPUTE BUILDOUT
Musk has outlined ambitious targets involving:
🔹 Approximately 13 GW of operational AI compute by 2027
🔹 A 440,000-GPU Nvidia Vera Rubin training cluster
🔹 Significant additional power and cooling infrastructure
🔹 Grok Bot becoming a major consumer of SI compute
If SpaceX delivers on those plans, its AI infrastructure footprint could expand dramatically.
But capacity alone doesn't generate attractive returns.
It needs paying customers, strong utilisation, efficient inference and pricing that supports healthy margins.
THE BULL CASE
I can see the strategic opportunity.
SpaceX has a growing AI business, substantial computing ambitions and products such as Grok Bot that could create recurring demand.
If adoption scales while inference costs decline, the economics could become increasingly attractive.
THE BEAR CASE
The capital requirements are enormous.
GPU infrastructure depreciates, newer hardware replaces older systems, and competition can put pressure on AI pricing.
There's also an important question about Grok Bot consuming most of the company's compute.
How much of that usage will generate profitable external revenue?
And how much infrastructure investment will be needed to support it?
MY TAKE
I'm impressed by SpaceX's ambition and the growth already appearing in its financial results.
But I wouldn't treat Musk's $500B–$1T ARR projection as established earning power or formal guidance.
For perspective, SpaceX's Q3 revenue represents an annualised run rate of approximately $58B. That isn't the same accounting measure as ARR, but it illustrates the extraordinary scale of the ambition.
The opportunity is potentially enormous. So is the execution risk.
For me, the investment case comes down to whether Grok Bot and the broader Super Intelligence business can generate enough high-quality recurring revenue to support the infrastructure being built.
A trillion-dollar revenue ambition captures attention. Sustainable margins, cash flow and returns on capital will determine what it's worth.
— EMMANUELINVEST

SPACEX $SPCX — ELON MUSK IS THINKING MUCH BIGGER THAN TODAY'S STARLINK NETWORK.
Musk is reportedly targeting 100,000 Starlink satellites within three years, with plans to reach two Starship launches per week by the end of 2027.
That's an ambitious expansion.
But what interests me isn't simply the number of satellites.
It's what this could mean for SpaceX's connectivity economics.
THE BIGGER PICTURE
SpaceX's Q3 results showed:
🔹 Connectivity Revenue: $5.25B, +69% YoY
🔹 Connectivity Operating Income: $2.37B, +99%
🔹 Starlink Consumer Subscribers: 13.6M, +89%
🔹 Starlink Monthly ARPU: $69
🔹 Total Quarterly CapEx: $19.59B
Connectivity is already a major profit engine for SpaceX.
Expanding the satellite network could support greater capacity, wider coverage and additional enterprise, aviation, maritime and direct-to-device opportunities.
WHY STARSHIP MATTERS
SpaceX's recent Starship mission deployed 26 next-generation Starlink V3 satellites.
The company says those satellites represent approximately 10 times the downlink capacity added by a Falcon 9 Starlink launch.
If Starship becomes reliably reusable and launch frequency increases, SpaceX could deploy substantially more network capacity.
That could change the economics of expanding Starlink.
But launch cadence, satellite production, regulatory approvals and operating reliability all have to scale together.
MY TAKE
I see the strategic opportunity.
A larger network could strengthen Starlink's competitive position and support new revenue streams.
But more satellites don't automatically mean higher returns.
SpaceX still has to manage deployment costs, satellite replacement cycles and pricing pressure as it expands internationally.
And with ARPU below last year's level, capacity growth needs to translate into profitable demand.
For me, the investment question is whether Starship can make network expansion materially cheaper while Starlink continues growing operating income.
The ambition is enormous.
Execution and economics will determine how much of that ambition becomes shareholder value.
— EMMANUELINVEST

SUPERMICRO $SMCI SURGES 11.5% AFTER HOURS. THE AI REVENUE UPGRADE IS HUGE — BUT THE MARGIN IMPROVEMENT MAY MATTER EVEN MORE.
Supermicro closed at $32.47, then jumped to $36.20 after hours, following its preliminary Q1 FY2027 update.
And looking at the numbers, I can understand why investors are paying attention.
THE UPGRADE
🔹 Revenue: $18.5B–$19.5B
🔹 Previous Guidance: $14.5B–$15.5B
🔹 Consensus: Approximately $15.6B
🔹 Gross Margin: 12.0%–12.5%
🔹 Previous Margin Guidance: 10.4%–10.8%
At the midpoint, that's a $4B increase in expected quarterly revenue and a 165-basis-point improvement in gross margin.
But here's what stands out to me.
THE IMPLIED GROSS PROFIT INCREASE IS EVEN BIGGER
Under the previous guidance, midpoint revenue of $15B at a 10.6% gross margin implied approximately $1.59B in gross profit.
Under the new preliminary outlook, $19B at 12.25% implies approximately $2.33B.
That's roughly $738M more implied gross profit, or an increase of approximately 46%.
For a company operating in the highly competitive AI server market, that matters.
It suggests stronger demand is being accompanied by better expected gross profitability.
WHY I'M STILL WATCHING CASH FLOW
This is a preliminary, unaudited update.
We haven't yet seen the full picture on operating expenses, inventory, receivables or cash generation.
And those numbers matter enormously for a hardware business scaling this quickly.
Higher revenue doesn't automatically mean stronger free cash flow.
MY TAKE
The after-hours reaction is understandable.
Supermicro has delivered a substantial upgrade to both revenue and expected gross margin.
That's a stronger signal than revenue growth alone.
But the full earnings report on November 3 needs to confirm whether the improved gross economics are translating into operating profits and healthy cash conversion.
The AI demand is showing up in the numbers. Now I want to see how much of it becomes sustainable cash flow.
— EMMANUELINVEST
CHUBB $CB — EARNINGS BEAT BY 12.5%, BUT INSURANCE PROFITABILITY IS UNDER PRESSURE.
Chubb delivered better-than-expected Q3 earnings, supported by higher investment income and continued profitability across its insurance businesses.
But beneath the headline beat, underwriting income declined and catastrophe losses increased sharply.
For me, the key question is whether this is mainly a difficult catastrophe quarter or the beginning of broader pressure on underwriting margins.
THE NUMBERS
🔹 Adjusted EPS: $7.66 vs $6.81 expected, +0.8% YoY
🔹 GAAP EPS: $7.30, +4.4% YoY
🔹 Net Income: $2.84B, +1.5%
🔹 Core Operating Income: $2.98B, −2.2%
🔹 P&C Net Premiums Written: $13.18B vs $13.45B expected
🔹 P&C Underwriting Income: $2.06B, −8.8%
🔹 Core Operating ROE: 14.9%
🔹 Core Operating ROTE: 21.6%
The earnings beat is encouraging, but the year-over-year profit growth was much more modest.
UNDERWRITING — THE REAL STORY
🔹 P&C Combined Ratio: 84.1% vs 81.8% last year
🔹 Current Accident Year Combined Ratio Excluding Catastrophes: 82.6% vs 82.5%
🔹 Catastrophe Losses: $705M vs $285M last year
🔹 Favourable Prior-Period Reserve Development: $511M vs $361M
The combined ratio deteriorated by 2.3 percentage points.
For every $100 of relevant insurance premiums earned, Chubb incurred approximately $84.10 in claims and underwriting expenses.
That's still profitable underwriting.
But the distinction matters.
Excluding catastrophes, the current accident year combined ratio was almost unchanged.
That suggests the sharp increase in catastrophe losses was a major contributor to the weaker reported underwriting result.
However, favourable development of reserves from prior periods also supported earnings.
WHERE PREMIUMS ARE GROWING
🔹 North America Commercial: $5.51B, −2.7% YoY
🔹 North America Personal: $1.91B, +5.3%
🔹 North America Agricultural: $1.53B, +5.1%
🔹 Overseas General: $3.94B, +6.7%
🔹 Global Reinsurance: $287M, −5.6%
The weakness in North American commercial insurance stands out.
Management expects commercial growth to improve in future quarters, but that recovery still needs to materialise.
Overseas General and North American Personal were stronger contributors.
INVESTMENT INCOME IS HELPING
🔹 Adjusted Net Investment Income: $1.89B, +6.3% YoY
🔹 Life Net Premiums Written: $1.96B, +1.4%
🔹 Life Segment Income: $369M, +11.4%
Higher investment income provides another source of earnings alongside underwriting.
That's valuable when catastrophe losses rise, although it doesn't eliminate underwriting risk.
CAPITAL RETURNS + BOOK VALUE
🔹 Total Capital Returned: $1.57B
🔹 Share Repurchases: $1.18B
🔹 Dividends: $393M
🔹 Book Value Per Share: $191.43, +5.1% YoY
🔹 Tangible Book Value Per Share: $126.96, +5.7% YoY
Chubb continues returning capital while growing book value per share.
For a mature insurer, that combination matters.
MY TAKE
I see a resilient insurance business, but not an entirely clean earnings beat.
The positives are clear: underwriting remains profitable, underlying accident-year performance excluding catastrophes was stable, investment income increased and book value per share grew.
But P&C premiums missed expectations, North American commercial premiums declined and catastrophe losses weighed on underwriting profitability.
The favourable reserve development also deserves attention when assessing earnings quality.
For me, the next test is whether North American commercial growth recovers while Chubb maintains its strong underlying underwriting margins.
The earnings beat is encouraging.
But sustained underwriting discipline and book value growth matter more than one quarter's EPS surprise.
— EMMANUELINVEST

PEGASYSTEMS $PEGA — CLOUD ACV UP 20%. TOTAL ACV UP JUST 6%. WHAT'S HOLDING BACK GROWTH?
Pegasystems delivered another quarter of strong Pega Cloud growth, but the broader business is growing much more slowly.
That's the part of the earnings report that interests me.
The cloud transition is working. The question is whether it can drive faster overall growth and stronger cash generation.
THE NUMBERS
🔹 Revenue: $393M, +3% YoY
🔹 GAAP Net Income: $14M, −68%
🔹 GAAP EPS: $0.08, −67%
🔹 Non-GAAP Net Income: $60M, +8%
🔹 Non-GAAP EPS: $0.35, +17%
🔹 Total Backlog: $2.01B, +15%
THE CLOUD STORY
🔹 Pega Cloud ACV: $976M, +20%
🔹 Total ACV: $1.65B, +6% reported / +7% constant currency
🔹 Pega Cloud Revenue: $219M, +19%
🔹 Subscription Services Revenue: $292M, +10%
Pega Cloud now represents approximately 59% of total ACV.
That's an important milestone.
But the difference between 20% cloud ACV growth and 6% total ACV growth suggests the expansion of cloud subscriptions is being partly offset by weaker performance elsewhere.
Maintenance and subscription licence revenue declined, while consulting revenue fell 18%.
WHAT'S CHANGING UNDERNEATH?
Management reported its strongest quarterly ACV addition of the year.
That's encouraging, particularly after acknowledging challenges in go-to-market execution.
But larger technology deals are facing greater scrutiny, and AI disruption is changing how customers evaluate enterprise software spending.
Pega is responding with changes intended to improve sales execution and accelerate growth.
The next few quarters should show whether those changes are working.
PROFITABILITY — TWO DIFFERENT STORIES
GAAP net income fell 68%, while non-GAAP net income increased 8%.
A $16M litigation settlement, alongside elevated legal expenses, weighed on reported profitability.
That means I wouldn't interpret the GAAP earnings decline as evidence that underlying operating performance deteriorated by the same amount.
But I also wouldn't ignore the cash flow picture.
CASH FLOW — THE BIGGER CONCERN
🔹 Nine-Month Operating Cash Flow: $304M, −12%
🔹 Nine-Month Free Cash Flow: $290M, −14%
🔹 2028 Free Cash Flow Target: More than $700M
Management has warned that cash generation could remain under pressure through the remainder of 2026.
For me, this is where the investment case becomes more demanding.
Growing cloud subscriptions is encouraging, but shareholders ultimately need that growth to support stronger cash generation.
And the $700M-plus FCF target for 2028 will require meaningful progress from current levels.
MY TAKE
I like the direction of the cloud business.
Pega Cloud ACV is growing 20%, cloud revenue is expanding, and the company has a substantial backlog.
But I'm not convinced the broader growth story has turned the corner yet.
Total ACV is growing only 6%, revenue increased 3%, and nine-month free cash flow declined.
The encouraging development is the stronger Q3 ACV addition. The unanswered question is whether it marks the beginning of sustained improvement.
For $PEGA, I'll be watching total ACV growth, sales execution and cash conversion more closely than cloud growth alone.
The cloud transition is progressing. Now Pega needs to prove it can accelerate the entire business.
— EMMANUELINVEST

SPACEX $SPCX — REVENUE SURGES 161%. SUPER INTELLIGENCE IS NOW THE BIGGEST BUSINESS. BUT LOOK AT THE CAPEX.
SpaceX delivered a remarkable Q3 2026, beating revenue and adjusted EBITDA expectations as its Super Intelligence (SI) business expanded rapidly.
What interests me is how dramatically the company is changing.
SpaceX is no longer just a rocket and satellite connectivity story. AI infrastructure is becoming central to its financial performance.
THE NUMBERS
🔹 Revenue: $14.58B vs $12.87B expected, +161% YoY
🔹 EPS: $0.35 vs −$0.36 last year
🔹 Operating Income: $2.79B vs $2.24B expected
🔹 Adjusted EBITDA: $8.81B vs $6.59B expected, +306% YoY
🔹 Net Income: $4.40B vs a $1.05B loss last year
Revenue beat expectations by approximately 13%, while adjusted EBITDA exceeded estimates by roughly 34%.
THREE BUSINESSES — VERY DIFFERENT ECONOMICS
SUPER INTELLIGENCE
🔹 Revenue: $7.56B, +830% YoY
🔹 Operating Income: $431M, versus a $1.72B loss last year
🔹 Adjusted EBITDA: $4.95B, versus a $428M loss
SI now accounts for approximately 52% of total revenue.
That's a major shift in the company's business mix.
But SI operating margin is only around 5.7%, despite its substantial adjusted EBITDA contribution.
The gap between those profitability measures deserves attention, particularly given the scale of infrastructure investment.
CONNECTIVITY — THE PROFIT ENGINE
🔹 Revenue: $5.25B, +69% YoY
🔹 Operating Income: $2.37B, +99% YoY
🔹 Adjusted EBITDA: $3.50B, +82% YoY
🔹 Starlink Subscribers: 13.6M, +89% YoY
🔹 Monthly ARPU: $69 vs $83 last year
Connectivity generated approximately 45% operating margin.
That makes it an important source of earnings while SpaceX expands its AI operations.
But subscriber growth is outpacing revenue growth, and ARPU is declining.
I'll be watching whether scale and operating efficiency can offset that pressure.
SPACE — EXECUTION STILL MATTERS
🔹 Revenue: $1.77B, +6% YoY
🔹 Operating Loss: $7M, versus $259M profit last year
🔹 Adjusted EBITDA: $357M, −47% YoY
🔹 Launches: 35 vs 41 expected, down from 44 last year
🔹 Mass to Orbit: 476 metric tonnes vs 559 expected
Space remains strategically important, but quarterly operating performance was weaker.
The company also reported its first revenue-generating Starship mission, deploying 26 Starlink V3 satellites.
That could improve future deployment economics if Starship achieves reliable, repeatable operations at scale.
THE $19.59B CAPITAL SPENDING QUESTION
🔹 Total CapEx: $19.59B
🔹 Super Intelligence: $16.44B
🔹 Space: $1.61B
🔹 Connectivity: $1.54B
Approximately 84% of quarterly capex went into SI.
That tells me where management sees the largest opportunity.
But it also shows how much capital must be committed before the full economic benefits can emerge.
Reported SI revenue is growing rapidly, yet investors still need to understand depreciation, financing, utilisation and the returns on this expanding compute base.
WHAT'S CHANGING
🔹 Nameplate Compute Capacity: 1.7 GW
🔹 Cash + Equivalents: $51.29B
🔹 Marketable Securities: $38.56B
🔹 SI revenue benefited from cloud agreements, Cursor and AI software applications
🔹 Grok Bot introduced as an always-on agentic SI system
The balance sheet provides substantial liquidity, but the investment requirements are equally significant.
And because Cursor was acquired during the year, I'd want to distinguish acquired revenue from organic growth before extrapolating SI's 830% increase.
MY TAKE
I'm impressed by the scale of SpaceX's transformation.
Connectivity is producing substantial operating profit, while SI has moved from operating losses to positive operating income.
That's meaningful progress.
But I wouldn't overlook the economics beneath the headline growth.
SI generated $7.56B in revenue and $431M in operating income, while absorbing $16.44B in quarterly capex.
Those aren't directly comparable measures of investment return, but they highlight the scale of spending required to build the business.
The next question isn't simply how quickly SpaceX can expand compute capacity.
It's whether that capacity can generate durable margins, free cash flow and attractive returns over its useful life.
The growth is impressive. The return on the AI investment is what I'll be watching next.
— EMMANUELINVEST

INTUITIVE SURGICAL $ISRG — REVENUE UP 22%, BUT WHY DID GAAP PROFITS FALL?
Intuitive Surgical delivered strong Q3 2026 revenue growth, supported by rising surgical procedures, increased da Vinci system placements and continued expansion of its installed base.
But beneath the strong operating performance, reported GAAP profitability moved in the opposite direction.
THE NUMBERS
🔹 Revenue: $3.05B, +22% YoY
🔹 Non-GAAP EPS: $3.00 vs $2.40 last year
🔹 GAAP EPS: $1.49 vs $1.95 last year
🔹 Non-GAAP Net Income: $1.05B vs $867M last year
🔹 GAAP Net Income: $522.8M vs $704.4M last year
🔹 Non-GAAP Operating Income: $1.27B vs $976M last year
🔹 GAAP Operating Income: $592.6M vs $759.7M last year
That's a meaningful divergence.
Adjusted profitability improved, but GAAP operating income declined approximately 22%.
I wouldn't ignore that simply because the headline revenue growth was strong.
WHAT'S DRIVING THE BUSINESS?
🔹 Worldwide Procedure Growth: +15% YoY
🔹 da Vinci Procedure Growth: +14%
🔹 Ion Procedure Growth: +31%
🔹 da Vinci System Placements: 546 vs 427 last year
🔹 Installed Base: 12,094 systems, +12%
🔹 Services Revenue: $482.2M vs $395.9M last year
These are encouraging operating indicators.
More installed systems create opportunities for additional procedures, instruments, accessories and service revenue.
That's what makes Intuitive's business model attractive.
The company isn't relying solely on selling new robotic systems. Its growing installed base can support recurring revenue over time.
2026 GUIDANCE
🔹 da Vinci Procedure Growth: 14–15%, closer to the midpoint
🔹 Non-GAAP Gross Margin: 68.7–69.3%
🔹 Non-GAAP Operating Expense Growth: 11–13%
Management also warned that additional tariffs could affect results, with its margin outlook assuming current tariffs remain in place through year-end.
CASH + CAPITAL RETURNS
🔹 Share Repurchases: $2.94B
🔹 Shares Repurchased: 7.8M
🔹 Cash, Cash Equivalents + Investments: $6.80B
🔹 Quarterly Decline in Cash + Investments: $1.83B
The buybacks demonstrate substantial capital deployment, but they're also worth considering alongside the reduction in liquidity.
MY TAKE
I like the underlying business momentum.
Procedure growth remains healthy, da Vinci placements are increasing, and Ion is expanding rapidly.
That supports the longer-term opportunity for robotic-assisted surgery.
But the earnings quality deserves closer attention.
Revenue grew 22% and adjusted operating income increased, yet GAAP operating income and net income declined.
The next thing I want to understand is what's driving that gap and how much of the excluded costs investors should treat as recurring.
For me, the investment case rests on two things:
Continued growth in procedures and recurring revenue, alongside stronger conversion of that growth into sustainable GAAP profitability.
The business is expanding. The question is how much of that growth ultimately reaches shareholders.
— EMMANUELINVEST

CAPITAL ONE $COF — A 22% EARNINGS BEAT. BUT CREDIT QUALITY AND THE DISCOVER INTEGRATION MATTER MORE.
Capital One reported Q3 2026 adjusted EPS well ahead of expectations, while revenue was broadly in line.
What interests me isn't just the earnings beat. It's how the enlarged business is performing following the Discover acquisition.
THE NUMBERS
🔹 Revenue: $16.30B vs $16.27B expected
🔹 Adjusted EPS: $6.69 vs $5.50 expected — beat by approximately 22%
🔹 GAAP EPS: $5.61, +16% YoY
🔹 Net Income: $3.5B
🔹 Net Interest Margin: 8.41%
🔹 Pre-Provision Earnings: $7.5B
🔹 Efficiency Ratio: 54.19%
🔹 Adjusted Efficiency Ratio: 48.76%
🔹 CET1 Capital Ratio: 13.8%
The adjusted earnings beat is impressive, while the CET1 ratio suggests Capital One retains a substantial capital buffer.
CREDIT QUALITY — WHAT I'M WATCHING
🔹 Provision for Credit Losses: $2.9B
🔹 Net Charge-offs: $3.1B
🔹 Loan Reserve Release: $225M
🔹 Non-Interest Expense: $8.9B
The $225M reserve release is worth noting because it can support reported profitability.
But a reserve release isn't the same as an improvement in underlying borrower repayment performance.
I'd want to see the trend in delinquencies, charge-off rates and loan balances before concluding that consumer credit conditions are improving.
LOANS + DEPOSITS
🔹 Total Loans: $462.5B
🔹 Credit Card Loans: $276.4B
🔹 Consumer Banking Loans: $94.0B
🔹 Commercial Banking Loans: $92.1B
🔹 Period-End Deposits: $480.7B
Credit cards account for approximately 60% of total loans.
That makes consumer spending, employment and household credit quality particularly important to the investment case.
DISCOVER + BREX INTEGRATION
🔹 Acquisition Amortisation: $483M pre-tax
🔹 Discover Integration Costs: $338M pre-tax
🔹 Brex Integration Costs: $47M pre-tax
Management says the Discover integration is progressing well and that expected synergies remain on track.
I see the strategic attraction.
Combining lending scale with Discover's payments network could create opportunities across funding, payments economics and customer relationships.
But investors still need evidence that the expected synergies are materialising and that integration costs are beginning to decline.
MY TAKE
I like the scale of the adjusted earnings beat and Capital One's capital position.
But I wouldn't assess this quarter on adjusted EPS alone.
The business is managing substantial credit exposure while integrating major acquisitions.
And the $225M reserve release is another reason to look beyond the headline earnings number.
For me, the next test is whether Capital One can maintain strong profitability, improve operating efficiency and deliver Discover synergies without deterioration in consumer credit quality.
That's what will determine whether this earnings beat represents sustainable progress rather than simply a strong quarter.
— EMMANUELINVEST

SPACEX $SPCX — REVENUE UP 161%, BUT THE AI INFRASTRUCTURE BILL IS ENORMOUS.
The reported Q3 figures point to extraordinary growth across SpaceX's connectivity and AI-related businesses.
But the most interesting number isn't revenue. It's capital expenditure.
THE REPORTED NUMBERS — Q3 2026
🔹 Revenue: $14.6B, +161% YoY
🔹 EPS: $0.35
🔹 Net Income: $4.4B
🔹 Adjusted EBITDA: $8.8B, +306% YoY
🔹 Operating Cash Flow: $13.1B
🔹 Capital Expenditure: $19.6B
On those figures, operating cash flow less capex would be approximately negative $6.5B.
That's a reminder of how capital-intensive this expansion has become.
WHERE THE GROWTH IS COMING FROM
🔹 Space: $1.8B revenue, +6% YoY
🔹 Connectivity: $5.2B, +69%
🔹 SI: $7.6B, +830%
🔹 Starlink Consumer Subscribers: 13.6M
The reported SI segment is growing far faster than the traditional space business.
That suggests SpaceX's investment story is increasingly tied to computing and AI infrastructure alongside launch services and satellite connectivity.
THE BULL CASE
SpaceX combines launch capabilities, a growing satellite network and substantial investment in computing infrastructure.
If its AI-related revenue continues scaling and infrastructure utilisation improves, today's spending could support a much larger business.
THE BEAR CASE
Capital spending is already substantial.
Strong EBITDA doesn't eliminate the need to fund equipment, facilities and future capacity.
Investors still need to understand financing costs, depreciation, utilisation and the eventual returns on these investments.
MY TAKE
I'm impressed by the scale of the reported growth.
But I wouldn't value this business on revenue or adjusted EBITDA growth alone.
The critical question is whether SpaceX can turn its expanding AI and connectivity businesses into enough sustainable cash flow to justify the extraordinary capital being committed.
That's the number I'll be watching beyond the headline earnings.
— EMMANUELINVEST

NETFLIX $NFLX — PROFITS SURGE 37%, BUT GUIDANCE RAISES SOME IMPORTANT QUESTIONS.
Netflix delivered a strong Q3 2026, beating earnings expectations and expanding operating margins.
But while the quarter itself looks impressive, the updated outlook tells a more complicated story.
THE NUMBERS
🔹 Revenue: $12.87B vs $12.87B expected, +12% YoY
🔹 EPS: $0.87 vs $0.82 expected, +49% YoY
🔹 Operating Income: $4.46B vs $4.26B expected, +37% YoY
🔹 Operating Margin: 34.6%, up 640 basis points
🔹 Net Income: $3.66B vs $3.45B expected
🔹 Free Cash Flow: $2.88B vs $3.18B expected, up from $2.66B last year
What stands out to me is the operating leverage.
Revenue increased 12%, but operating income grew 37%.
Netflix is converting a larger share of its revenue into operating profit.
FY2026 GUIDANCE — MIXED
🔹 Revenue: $51.1B vs $51.23B expected
🔹 Operating Margin: 31.5%
🔹 Free Cash Flow: Approximately $12B, reduced from $12.5B
🔹 Advertising Revenue: Approximately $2.7B, down from the previous outlook of roughly $3B
The advertising revision is particularly interesting.
Netflix has been building advertising into a more important part of its long-term growth strategy.
Reducing the forecast by around 10% raises questions about how quickly that business is scaling relative to management's earlier expectations.
The FCF reduction also needs context.
Management attributes it primarily to the expected timing of a real estate transaction in Q4, rather than simply weaker operating performance.
That's an important distinction.
Q4 GUIDANCE — BELOW EXPECTATIONS
🔹 Revenue: $13.44B vs $13.52B expected
🔹 EPS: $0.67 vs $0.73 expected
🔹 Operating Income: $3.50B vs $3.73B expected
🔹 Operating Margin: 26.0%
Q4 guidance is softer than consensus across revenue, earnings and operating profit.
That doesn't erase the strong Q3 performance, but it does suggest investors should be careful about extrapolating this quarter's margin expansion.
REGIONAL REVENUE
🔹 US + Canada: $5.63B, +11% YoY
🔹 Europe, Middle East + Africa: $4.11B, +11%
🔹 Latin America: $1.60B, +17%
🔹 Asia-Pacific: $1.54B, +12%
Latin America delivered the fastest reported growth, while the other regions continued expanding at double-digit rates.
The geographic breadth of growth is encouraging.
ADVERTISING + CONTENT STRATEGY
Netflix plans to expand its advertising tier into 15 additional countries in 2027.
It also highlighted its TF1 partnership and continued investment in programming, including live sports.
I see the strategic logic.
Advertising creates another way to monetise engagement, while live programming can strengthen the value of the platform.
But the lower advertising revenue outlook means execution deserves closer attention.
CASH FLOW + CAPITAL RETURNS
🔹 Operating Cash Flow: $3.16B vs $2.83B last year
🔹 Q3 Free Cash Flow: $2.88B vs $2.66B last year
🔹 Share Repurchases: $4.8B
🔹 Remaining Buyback Authorisation: $22.3B
🔹 Cash: $8.2B
🔹 Gross Debt: $15.3B
Netflix also issued $1B in bonds during the quarter to fund an upcoming $1B debt maturity.
That is primarily a refinancing decision, rather than evidence of a comparable increase in underlying operating investment.
MY TAKE
I like what Netflix is delivering operationally.
Double-digit revenue growth, 37% operating profit growth and a 640-basis-point improvement in operating margin are impressive.
But I wouldn't ignore the weaker guidance.
The advertising revenue forecast has been reduced, Q4 expectations are below consensus, and the company has lowered its full-year FCF outlook.
The FCF adjustment appears largely timing-related, but the advertising revision is more relevant to the long-term growth thesis.
For me, the next test is whether Netflix can sustain its margin improvement while accelerating advertising revenue and maintaining strong engagement.
The quarter shows the strength of the business.
The guidance tells us where expectations need to be reassessed.
— EMMANUELINVEST

UNITED AIRLINES $UAL — REVENUE UP 17.4%, BUT PROFITS ARE UNDER PRESSURE.
United Airlines delivered strong Q3 2026 revenue growth, supported by premium travel, loyalty and corporate demand.
But there's a clear disconnect between revenue growth and adjusted earnings.
THE NUMBERS
🔹 Revenue: $17.88B vs $17.89B expected — broadly in line, +17.4% YoY
🔹 Adjusted EPS: $2.54 vs $2.59 expected — miss, −8.6% YoY
🔹 GAAP EPS: $3.14, +8.3% YoY
🔹 Adjusted Operating Income: $1.23B vs $1.26B expected
🔹 Adjusted Pre-Tax Income: $1.11B, in line with estimates
🔹 Adjusted Net Income: $833M vs $867M expected
GUIDANCE — STRONG REVENUE OUTLOOK
Management expects Q4 revenue growth above 20% YoY.
That's encouraging, particularly given the strength across several important revenue streams.
But the key question is how much of that growth can translate into earnings.
WHAT'S CHANGING UNDERNEATH?
🔹 Premium Revenue: +17% YoY
🔹 Basic Economy: +16%
🔹 Loyalty: +17%
🔹 Cargo: +23%
🔹 Contracted Business: +26%
This tells me demand isn't concentrated in just one part of United's business.
Premium customers, corporate travel and loyalty are all contributing.
BUT COSTS ARE THE PROBLEM
🔹 Revenue per Available Seat Mile (TRASM): 20.19¢, +15.9%
🔹 Adjusted Unit Costs Excluding Fuel (CASM-ex): 13.09¢, +7.8%
🔹 Average Fuel Price: $3.90/gallon, +60.3%
🔹 Fuel Expense: Up $1.8B YoY
🔹 Capacity: +1.3%
🔹 Load Factor: 83.9%, down 0.5 percentage points
United is generating substantially more revenue from relatively modest capacity growth.
That's encouraging for pricing and revenue productivity.
But fuel inflation is absorbing a meaningful portion of the improvement.
ONE IMPORTANT ACCOUNTING DETAIL
GAAP EPS rose while adjusted EPS declined.
The reported results include $294M of gains from aircraft sale-leaseback transactions, contributing to net gains and special items.
I would therefore put more weight on adjusted profitability when assessing the underlying operating trend.
STARLINK + CUSTOMER LOYALTY
United has installed Starlink on more than 640 aircraft and is expanding its international network with 10 new destinations.
Management believes improved connectivity, service and technology are helping attract customers who remain loyal after their first experience.
I like that strategy.
Better customer experience can support retention, premium demand and pricing power.
But the financial benefits still need to justify the investment.
MY TAKE
I'm encouraged by United's revenue growth, particularly the strength in premium, corporate and loyalty demand.
And Q4 revenue guidance suggests that momentum could continue.
But I'm not ignoring the earnings pressure.
Revenue grew 17.4%, while adjusted EPS fell 8.6%.
That tells me the challenge isn't necessarily finding customers. It's protecting profitability as operating costs rise.
For investors, the next question is whether United can sustain its revenue momentum while recovering enough margin to deliver stronger adjusted earnings.
Strong demand is encouraging. Turning it into higher profits is the real test.
— EMMANUELINVEST

MUELLER INDUSTRIES $MLI — DATA CENTRE DEMAND IS STRONG. BUT REVENUE GROWTH ISN'T THE SAME AS PROFIT GROWTH.
Mueller Industries reported Q3 2026 revenue well ahead of expectations, supported by higher copper prices and healthy demand across its businesses.
What caught my attention was management's commentary that US data-centre expansion helped drive growing backlogs across all three segments.
THE NUMBERS
🔹 Revenue: $1.42B vs $1.28B expected — beat by approximately 11%, up 31% YoY
🔹 GAAP EPS: $1.00, +6% YoY
🔹 Operating Income: $281.6M, +2% YoY
🔹 Net Income: $221.2M, +6% YoY
🔹 Operating Cash Flow: $337M
🔹 Cash + Short-Term Investments: $1.48B
WHAT'S CHANGING UNDERNEATH?
Copper prices played an important role.
Average COMEX copper prices reached $6.48/lb, up 34.2% YoY.
That helps explain why revenue increased much faster than operating profit.
Based on the reported figures, operating margin was approximately 19.8%, compared with roughly 25.4% a year earlier.
So while the top line looks impressive, the margin picture is more complicated.
SEGMENT PERFORMANCE
🔹 Piping Systems: $890.6M revenue | $225.3M operating income
🔹 Industrial Metals: $409.4M revenue | $33.7M operating income
🔹 Climate: $142.8M revenue | $46.3M operating income
Piping Systems remains the largest contributor to profitability.
Management also reported healthy demand and growing backlogs across all segments, supported by US data-centre expansion and commercial construction.
CAPITAL ALLOCATION
🔹 Repurchased 3.2M shares for $201.9M
🔹 Quarterly dividend increased to $0.175 from $0.125 per share
🔹 Results included $9.4M in acquisition-related purchase accounting charges
The company has substantial liquidity and continues returning capital to shareholders.
MY TAKE
I find Mueller interesting because it offers a different way to look at the AI infrastructure buildout.
Not every beneficiary needs to manufacture GPUs or operate data centres.
The expansion of physical infrastructure also creates demand for piping, industrial metals and climate-related equipment.
But I wouldn't treat the 31% revenue increase as evidence of equally strong underlying volume growth.
Copper inflation contributed to the sales increase, while operating profit grew just 2%.
The next thing I want to see is whether stronger data-centre demand and growing backlogs translate into higher volumes, better margins and sustained cash generation.
That's where the investment case becomes more compelling.
— EMMANUELINVEST
ADIDAS JUST DELIVERED RECORD Q3 RESULTS AND RAISED ITS FULL-YEAR PROFIT OUTLOOK. BUT THERE'S AN IMPORTANT DETAIL IN THE NUMBERS.
Adidas reported preliminary third-quarter results showing strong sales growth, improving margins and record operating profit.
THE NUMBERS
🔹 Revenue: €7.25B, +9%
🔹 Currency-neutral revenue growth: +7%
🔹 Gross margin: 54.3%, up 250 basis points
🔹 Operating profit: €1.01B, +37%
The company also raised its 2026 operating profit outlook from approximately €2.3B to €2.5B.
WHAT'S DRIVING THE IMPROVEMENT?
Stronger full-price sales and brand momentum are supporting profitability.
But there's another factor investors shouldn't overlook.
Adidas received approximately €200M in US tariff refunds during the quarter, contributing to its margin improvement.
That matters because not all of the reported profit growth necessarily reflects recurring operational improvement.
GUIDANCE — RAISED
Adidas now expects currency-neutral revenue growth of 9–10% for 2026.
Management also plans to reinvest around €100M in Q4 into initiatives intended to support future growth.
MY TAKE
I like the underlying improvement in sales and full-price selling. It suggests Adidas is strengthening its competitive position.
But I wouldn't simply extrapolate the 37% operating profit growth into future quarters.
The tariff refund provided a meaningful benefit, and the company is choosing to reinvest part of its improved profitability.
The next test is whether Adidas can sustain stronger margins and earnings growth without relying on one-off benefits.
Full Q3 results are scheduled for October 29.
— EMMANUELINVEST

US HOUSING — CONSTRUCTION ACTIVITY IS WEAKENING, BUT THE SIGNALS ARE MIXED.
September housing starts came in below expectations, while building permits held up slightly better.
THE NUMBERS
🔹 Housing Starts: 1.221M vs 1.300M expected
🔹 Housing Starts MoM: −5.2%
🔹 Building Permits: 1.400M vs 1.390M expected
🔹 Building Permits MoM: −0.2%
What caught my attention is the gap between starts and permits.
Builders are starting fewer homes, but the pipeline of potential future construction hasn't weakened as sharply.
That suggests caution rather than a complete collapse in housing activity.
MY TAKE
The housing market is still showing signs of pressure, and today's starts data reinforce that.
For investors, the next question is whether softer housing activity helps ease pressure on Treasury yields and borrowing costs.
But one housing report isn't enough to establish a broader economic slowdown.
Weak construction activity is a warning. Relatively resilient permits suggest the picture isn't entirely negative.
— EMMANUELINVEST
US HOUSING — PENDING HOME SALES JUST FELL 7.3%. THAT'S A BIG MISS.
September pending home sales dropped 7.3% month-on-month, against expectations for just a 0.5% decline.
And the weakness isn't limited to one comparison.
THE NUMBERS
🔹 Pending Home Sales MoM: −7.3% vs −0.5% expected
🔹 Pending Home Sales YoY: −11.3% vs −4.7% previously
🔹 Housing Starts: 1.221M vs 1.300M expected
🔹 Building Permits: 1.400M vs 1.390M expected
What stands out to me is that both homebuying activity and actual construction starts are weakening, even though permits have held up slightly better.
That suggests the housing market is facing pressure on more than one front.
MY TAKE
This is another sign of weakness in an interest-rate-sensitive part of the US economy.
It strengthens the case for watching whether borrowing costs and affordability are weighing on demand.
But weaker housing data alone don't guarantee lower Treasury yields or a change in Fed policy.
The housing slowdown is becoming harder to ignore. The next question is whether that weakness spreads into the broader economy.
— EMMANUELINVEST
COREWEAVE $CRWV — HSBC SEES MORE DOWNSIDE. I THINK THE DEBATE NEEDS MORE BALANCE.
HSBC has reiterated its Reduce rating on CoreWeave with a $39 price target, citing debt-market concerns and potentially slowing AI demand.
At the $58.79 price shown, that target implies roughly 34% downside.
I understand the debt concerns. I've never dismissed them.
But I'm getting tired of seeing CoreWeave discussed almost entirely through the lens of borrowing.
WHAT ABOUT THE BUSINESS BEING BUILT?
CoreWeave is investing heavily in GPU infrastructure to serve AI workloads. It has major customers, contracted demand and an opportunity to become an important provider of AI computing capacity.
That infrastructure is expensive. Nobody disputes that.
But there's a difference between a company facing financing pressure and a company facing collapsing customer demand.
Those are not interchangeable.
If HSBC believes AI demand is slowing, I'd be interested in the evidence. Are customers reducing commitments? Is utilisation weakening? Are contract economics deteriorating?
Those are the questions I'd want answered.
THE RISKS ARE REAL
Higher financing costs, refinancing requirements, customer concentration and GPU depreciation could all weigh on future returns.
And contracted revenue doesn't automatically translate into free cash flow.
But the bullish case deserves examination too.
CoreWeave's infrastructure, customer relationships and ability to deploy computing capacity have economic value. The question is how much of that value ultimately reaches shareholders.
MY TAKE
I'm bullish on CoreWeave. That doesn't mean I'm hyping the company or pretending the risks don't exist.
I want analysts to scrutinise the debt.
I also want them to scrutinise the demand, the contracts, the assets and the potential returns.
Strong AI demand doesn't eliminate financing risk. But financing risk doesn't automatically mean AI demand is weakening.
That's the distinction I think is getting lost in the CoreWeave debate.
— EMMANUELINVEST

HASBRO $HAS Q3 — MAGIC: THE GATHERING JUST CROSSED $600M IN QUARTERLY REVENUE.
Hasbro delivered a big earnings beat and raised its full-year outlook.
But what interests me most isn't the traditional toy business. It's how much growth Magic: The Gathering is generating.
THE NUMBERS
🔹 Revenue: $1.60B vs $1.48B expected
🔹 Adjusted EPS: $2.90 vs $1.86 expected
🔹 Adjusted Operating Profit: $541M, +52%
🔹 Magic: The Gathering: $616M, +34%
🔹 Wizards & Digital Gaming: $747M, +31%
🔹 Consumer Products: $828M, +4%
GUIDANCE RAISED
🔹 FY26 Revenue Growth: 7–9%, previously 5–7% (constant currency)
🔹 Adjusted EBITDA: $1.58B–$1.63B, previously $1.45B–$1.50B
There's one detail worth watching: approximately $55M of tariff refunds benefited adjusted operating profit.
So not all the profit improvement should be treated as recurring.
MY TAKE
I'm increasingly interested in Hasbro as an intellectual-property and gaming business, rather than simply a toy manufacturer.
Magic is growing much faster than Consumer Products, and that changes how I think about the company's earnings potential.
The opportunity is attractive. The question is whether Hasbro can sustain that momentum without becoming too dependent on one franchise.
For me, Magic is now the main story behind $HAS.
— EMMANUELINVEST
