

trading for 4 years.
New York, USA
Joined November 2026
- Tweets76
- Following6
- Followers85
- Likes118


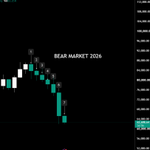



$BTC $55K !!!!
READ THIS BEFORE YOU DECIDE TO STAY ON THE SIDELINES.
$BTC is currently trading around $56K, and honestly, I don't think people fully understand how important this area could be.
Let's take a look at the Weekly timeframe.
We are approaching a major historical support zone, with price currently testing the descending trendline support that has been developing since early 2026.
There are a few things I want you to pay attention to:
1. The Weekly Support Zone
$BTC is approaching a critical support area around $55K–$56K. This is an area where I believe buyers could potentially step in and defend the market.
2. The Bigger Picture
If we look at the previous market structure, the $49K region is another important historical support level.
Even if Bitcoin experiences another downside move, I believe this is an area worth keeping on your radar.
3. Weekly RSI
RSI is currently sitting around 32, approaching oversold territory.
This doesn't guarantee an immediate reversal, but it tells us that selling momentum has become significantly stretched compared to recent price action.
Now, here's what I really want you to understand.
When Bitcoin was trading above $100K, everyone wanted to buy.
When it was making new highs, everyone was talking about how much higher it could go.
But now that Bitcoin has dropped significantly, suddenly everyone is convinced that the market is going to zero.
Isn't that interesting?
I'm not saying the bottom is guaranteed to be in. Nobody knows exactly where the bottom will be.
However, I believe this is the time to start paying attention, preparing your strategy, and considering whether these prices offer an attractive long-term opportunity.
You don't have to buy everything at once.
You can scale in gradually, keep some cash available, and manage your downside risk in case the market goes lower.
But one thing is certain:
You won't always get the opportunity to accumulate Bitcoin at these prices.
The market doesn't reward people who only become bullish when everything is already going up.
Sometimes, the best opportunities appear when sentiment is at its worst.
So, are you going to keep waiting for confirmation when Bitcoin is already recovering, or are you going to start preparing while the market is still offering discounted prices?
I'm watching this area very closely.
The next few weekly candles could be extremely important for Bitcoin.
#BTC #Bitcoin

$BTC
This is exactly what I was talking about yesterday.
I mentioned that if $BTC lost the $62K support level, we could see further downside toward $60K, and potentially even lower if selling pressure continued to build.
Well, not only did $BTC break below $62K, but we’re now seeing it trading around the $58K area. That’s a pretty significant move, especially considering how many people were still expecting the market to hold its previous support.
This is why I kept emphasizing the importance of key support levels and market structure. Once a major level breaks, the entire market structure can shift, and the next liquidity zone or support area can become the next target.
For now, I wouldn’t rush into any positions just because $BTC has already dropped significantly. We need to see how price reacts around these levels, whether buyers are willing to step in, and if there’s any sign of a potential reversal.
The next few daily closes will be very important. Let’s see whether $BTC can find some strength here or if there’s still more downside ahead. 👀


$BTC — The breakdown finally happening.
The $61,900 support level has officially been broken, putting Bitcoin under further bearish pressure on the 4H timeframe.
Here’s what I’m watching next:
• A potential retest of the $61,900–$62,000 area, which could now act as resistance.
• If sellers maintain control and reject that zone, BTC could continue moving lower.
• The next key area of interest is the $60,000 demand zone, where I expect buyers to potentially step in.
a significant liquidity pool has currently formed below $BTC in the 60–61.5K area
Above, liquidity remains concentrated in the 65.6–66.5K and 68–68.8K zones


bitcoin:native
“Will BTC revisit $48K?”
bitcoin:native is currently sitting around the $59K area, but there’s something interesting happening below the current price.
A significant amount of liquidity is accumulating around the $48K–$49K zone, exactly where I’ve marked the previous major support on the monthly timeframe.
If we look at the bigger picture, this area could become an interesting liquidity target, especially if $BTC continues to show weakness and fails to reclaim higher levels.
I’m not saying $BTC will definitely drop to $48K, but we shouldn’t ignore where the liquidity is concentrated.
Markets tend to move toward liquidity, and with so much sitting below the current price, a sweep of those lows is definitely something worth keeping an eye on.
The real question is: will BTC find enough demand to hold its current levels, or are we about to see another major liquidity sweep towards $48K?
Let’s see how this plays out.


bitcoin:native
Let’s see whether $BTC decides to move higher before sweeping the liquidity sitting below the recent lows.
We’ve seen a similar situation back in 2023 around the 10K–12K range. Most traders were convinced $BTC would eventually take out the major HTF liquidity below, but the market never gave them that move. It turned out that the obvious target wasn’t necessarily where price needed to go.
Not every liquidity pool has to be taken. Sometimes, the liquidity everyone is expecting becomes nothing more than a distraction.
We might be approaching a similar situation again. $BTC could establish a bottom above the major liquidation clusters, or make one final sweep before reversing.
Personally, I’m still holding my spot positions alongside my 2x long. Even if we revisit the 40K–50K region in the coming weeks, my approach remains the same. I don’t try to predict the exact bottom or chase every move. I prefer scaling in gradually when the risk aligns with my strategy.


$BTC — The breakdown finally happening.
The $61,900 support level has officially been broken, putting Bitcoin under further bearish pressure on the 4H timeframe.
Here’s what I’m watching next:
• A potential retest of the $61,900–$62,000 area, which could now act as resistance.
• If sellers maintain control and reject that zone, BTC could continue moving lower.
• The next key area of interest is the $60,000 demand zone, where I expect buyers to potentially step in.
a significant liquidity pool has currently formed below $BTC in the 60–61.5K area
Above, liquidity remains concentrated in the 65.6–66.5K and 68–68.8K zones
$BTC WEEKLY UPDATE
The last time we saw $BTC close this many consecutive weekly candles in the red was during the 2022 bear market.
Back then, $BTC recorded 9 consecutive bearish weekly candle closes.
And now, here we are again, sitting at 7 consecutive weekly candle closes in the red.
So the big question is...
Will history repeat itself, or is Bitcoin about to surprise everyone again?
I want to see how BTC reacts over the next few weekly closes. If selling pressure continues, we could potentially see history repeat itself.
But if buyers step in and defend the key demand zone, this could turn out to be one of those moments when the majority becomes too bearish right before the market reverses.
It’s exhausting watching this PA, but it is what it is. If you want to catch the big swings, you have to sit through periods like this.


$BTC
Tapping a Historical Uptrend Trendline here.
This is also the bottom of the Local Rising Channel we've been forming.
If we lose it, It's extremely unlikely for bulls to regain possession before the 50k's.

DreynaTrades retweeted
THIS IS EXACTLY WHY I'M BULLISH RIGHT NOW.
Because retail traders like you have already convinced themselves that the market is extremely bearish.
When everyone starts expecting lower prices, panic selling, and a much deeper correction, that's when I start paying closer attention to the bigger picture.
Don't let short-term fear blind you to the bigger structure.
I'm not saying the bottom is guaranteed, but I'm certainly not ready to turn bearish just because sentiment has shifted.
$BTC WEEKLY OUTLOOK !!!!
$BTC IS APPROACHING A CRITICAL DEMAND ZONE. DON'T IGNORE THIS AREA !!!
Looking at the weekly timeframe, I'm still keeping a bullish perspective on BTC as long as the $58K–$61K demand zone remains intact.
Here's why I'm paying close attention to this region:
We can also identify a potential **Bullish Quasimodo (QM) pattern** developing on the chart.
The structure is interesting:
- Price initially formed a swing low.
- Then swept below the previous low, creating a lower low.
- Buyers stepped in with a strong impulsive move, reclaiming the previous structure.
- Now, $BTC could be preparing for a corrective move back into the demand zone before potentially continuing higher.
This is exactly the kind of price action I want to see in a potential bullish Quasimodo setup.
My main scenario:
If $BTC manages to hold the $58K–$61K demand zone and shows a strong reaction from this area, I believe the broader weekly structure can remain bullish.
A potential recovery towards $68K–$74K could be the next move I'm watching.
Of course, this is a conditional scenario, not a guaranteed outcome. A decisive breakdown below the demand zone would invalidate or significantly weaken this bullish perspective.
For now, I'm watching how price reacts around this area.
The key is simple: As long as demand holds, I don't see a reason to abandon the bigger bullish picture just yet.


$BTC - Are You Ready??
$BTC is starting to form a bullish reversal structure, known as an Inverse Head and Shoulders, the opposite of the traditional Head and Shoulders pattern.
Another interesting factor is the current max pain scenario. The most painful move for the majority could actually be an upside move first, catching bears off guard and triggering short liquidations.
This could create additional buying pressure and push $BTC higher before any potential downside move.
Let’s see how price reacts and wait for confirmation before making any assumptions.
Almost every single long on Binance has been liquidated.
MAX pain is to the upside.


4
14
1,016
$ETH — Watching for a potential relief bounce.
$ETH is still trading within a clear downtrend, with the descending trendline acting as dynamic resistance. However, price could be approaching an area where we might see a short-term recovery.
I’m watching for a potential move back toward the $1,890–$1,990 supply zone, where sellers could step in again.
The idea is to see price reclaim the trendline, build some bullish momentum, and push into that resistance area before potentially facing another rejection.
For now, I wouldn’t rush to call a reversal. The overall structure remains bearish until proven otherwise.
Let’s see how price reacts at these key levels. Patience and confirmation over prediction. 👀


$BTC
Don’t assume the $52K liquidation cluster is a guaranteed destination. Liquidity below price doesn’t mean $BTC must go there.
We’ve seen similar setups before, where large liquidation pools remained untouched while price moved in the opposite direction.
Liquidation heatmaps are useful, but they shouldn’t be treated as a roadmap. Sometimes the liquidity everyone is targeting never gets swept, and chasing those levels blindly can lead to getting trapped.
Looking at the current daily structure, $BTC still has several unfilled FVG above price. I believe there’s a good chance we revisit these imbalance zones, potentially starting with $66K–$67K, followed by $68K–$71K.
My scenario is a possible dip toward $63K first, then a recovery toward the higher FVG.
Liquidity is not a destination, and FVG are not guaranteed targets. Watch how price reacts, not just where the liquidity sits.


DreynaTrades retweeted

$BTC
We currently have almost 17 times more potential short liquidations than long liquidations.
At this point, max pain has clearly shifted to the upside.
Of course, there will always be some liquidity below price, but the amount sitting above is far more attractive for MM's.

bitcoin:native
WHALES ARE BUYING bitcoin:native LIKE NEVER SEEN BEFORE
SOMETHING IS COMING BIG TIME 🚀
While retail investors are panic selling their Bitcoin at the bottom, whales seem to be doing the exact opposite. 🐋
Large players are taking advantage of the fear, accumulating $BTC while retail traders are dumping their bags at lower prices.
This is how market psychology works. When fear takes over, most people rush for the exit. Meanwhile, those with deeper pockets are looking for opportunities.
Retail sells the fear. Whales buy the opportunity.
Keep an eye on the money flow. The market often tells a different story than the crowd. 👀


$BTC
$BTC is attempting to stabilize around $64K after a strong sell-off.
If this support holds, I’m watching for a potential recovery toward $70K, followed by $73K and eventually the $77K–$80K FVG.
The liquidity heatmap also shows significant liquidity clusters around $75K–$80K, which could act as potential price magnets.
However, $64K needs to hold first. No confirmation, no assumptions.
Let price do the talking. 👀

$BTC
BOTTOM IS IN !!!
Bitcoin Fear and Greed Index is 10 ~ Extreme Fear
$BTC Current price: $63,483
Let’s take a step back and look at the bigger picture.
Here’s how I’m looking at it:
$50K–$60K: A major demand zone where I expect buyers to step in and defend the market.
$80K–$90K: The next important area to reclaim and build momentum.
$100K–$110K: A potential milestone before the next major expansion.
$150K: My long-term target for this cycle.
But one thing I want to emphasize: don’t let short-term market noise distract you from the bigger picture.
I’m still keeping my eyes on the higher timeframes. Sometimes, the best opportunities are the ones most people struggle to believe in.
The bigger picture matters.


