


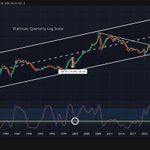





#Silver is back near the levels of a year ago.
Not so long ago, many were dreaming of getting another opportunity to buy the old breakout zone around $50.
Today, that opportunity is presenting itself, but doubt is dominating sentiment.
Market psychology never changes. When everyone is optimistic, everyone wants to buy. When fear takes over, very few dare to step in.
Perhaps these are exactly the moments when patience and conviction make all the difference.

Digger ⛏️ retweeted
That warning on the weekly chart is still playing out.
The weekly Stoch RSI continues to point lower, so further downside from here remains possible.
$55 is the next key level to watch, with $48–50 as a potential major support zone.
If #Silver reaches that zone and finds a bottom, it could ultimately prove to be the best opportunity of this entire correction.
Still cautious. But watching closely for a potential bottom.


A recovery on the daily chart is possible, and that is when things get interesting.
For the time being, the weekly indicators are pointing downwards. But if they recover, #Silver could head back up—though we aren't there yet.


Tourmaline Oil Corp $TOU.TO
Remember this one? 🦖
Confirmation is due at the end of the month, but this looks promising.

Tourmaline Oil Corp $TOU.TO
After years of consolidation, a powerful pattern is taking shape.
The contours tell the story: energy is building.
Some dinosaurs aren't sleeping; they are gathering strength for the next move 😉

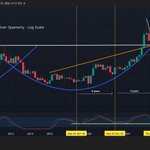
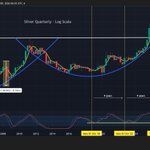
On the quarterly chart, the Stoch RSI is nearing the same level where #Silver has been bottoming out since 2018 with an interval of roughly four years.
The 2001–2011 bull run saw one major correction of 60%; the low in July 2026 represented a 55% drop.
A 60% decline would put the price at $48.70. While it may not necessarily reach that level, it suggests that Silver could be close to a bottom and that it is ultimately only a matter of time before it starts rising again.

#Uranium
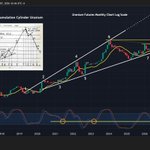
The monthly Stoch RSI is back at the same level where major moves higher started in 2021 and 2023 — and is now turning higher.
Meanwhile, the 200 MA and rising long-term trendline are converging, leaving uranium in an increasingly tight technical range.
The current structure also resembles Livermore’s accumulation cylinder, potentially setting up the next phase of the pattern.
$99.70 → $110.70 remain the key levels to reclaim.
If history rhymes, this could be the setup before the next major move higher.

That warning on the weekly chart is still playing out.
The weekly Stoch RSI continues to point lower, so further downside from here remains possible.
$55 is the next key level to watch, with $48–50 as a potential major support zone.
If #Silver reaches that zone and finds a bottom, it could ultimately prove to be the best opportunity of this entire correction.
Still cautious. But watching closely for a potential bottom.
A recovery on the daily chart is possible, and that is when things get interesting.
For the time being, the weekly indicators are pointing downwards. But if they recover, #Silver could head back up—though we aren't there yet.
Digger ⛏️ retweeted

I sat down with Stephen Roman yesterday for an interview covering Global Atomic (TSX: GLO), DASA construction progress, funding, and the company’s plans for 2028 #uranium production.
Watch here⬇️
youtu.be/Bj2MADIlAyM?si=xjBU…

