

Decode the markets like a pro | 17+ years in the markets | Data, Briefs & Guidance from $60/month 📉📊📈 *Trading involves risks.
Rejoins-Nous 🤝
Joined May 2024
- Tweets20.2K
- Following1.3K
- Followers5.8K
- Likes5.7K








Pinned Tweet
Derivatives Trading 82€ht/mois :
▸ Macroéconomie, microéconomie & géopolitique appliquées aux marchés
▸ Instruments financiers (dérivés compris)
▸ Analyse de l’environnement de marché & approche quantitative
▸ Compréhension de l’activité des market makers (hedging, grecques, etc.)
▸ Méthodologie de trading (processus décisionnel, routine, gestion du risque)
▸ Exercices corrigés : études de cas & mises en situation
▸ Simulation de gestion de portefeuille type Hedge Fund Multi stratégies
▸ 3 Briefings par jour
▸ Flow options Indices Live
▸ Flow option single Stocks Live
▸ Bloomberg Pro Terminal
▸ Flow et données professionnelles Forex, Metals, Bonds, Energies, Grains
Chaque module de formation est découpé en sous-modules. Il y a un socle commun accessible à tous, et des contenus plus avancés.
0 conflit d’intérêt avec Brokers et Propfirms. Pas de codes promo ni lien d’affiliation
Public :
Amateurs (Actuel 70%)
Étudiants Finance (Actuel 20%)
Professionnels (Actuel 10%)
Derivatives Trading retweeted

Merci @InseeFr
+0,6 % par an pendant 20 ans, cela explique sans doute les foules en liesse qui défilent actuellement dans Paris pour remercier le gouvernement.
Selon nos calculs, avec l’IPCH ce serait +0,3 % par an sur la même période, et 0 entre 2005 et 2015. Confirmez-vous ?


Derivatives Trading retweeted

Je n'aurais jamais décroché ce poste sans cette formation, alors merci @DerivativeProFR pour la qualité du contenu et de l'accompagnement 🙏
Un autre de nos fidèles étudiants rejoint l’un des plus importants desk Delta One interdealer au monde.
Chez nous, il a pu accroître ses compétences sur les dérivés et la volatilité qui lui serviront pour son job chez ce LP.
Félicitations à lui.
N’hésitez pas à nous rejoindre pour vraiment apprendre.

👇

Yeah, the numbers check out. The US 10YR yield is at 5.165%, so clearly above 5%. And the S&P 500 is at 7,743 : only about 1% below its record high of 7,817 from August 13, 2026.
That’s the interesting part. Normally, when risk-free rates are this high, you’d expect stocks to get pressured, because higher discount rates make future earnings worth less today. But that’s not happening.
Why ? Maybe earnings growth is strong enough to offset it. Maybe high yields are mostly about inflation, not super-tight real rates. Maybe the equity risk premium has just compressed.
Or maybe sector rotation is doing the work, banks and energy can actually benefit from higher rates, even if rate-sensitive sectors struggle.
Calling it a contradiction, or saying « we were lied to, » is way too dramatic. Rates and stocks have never had a simple inverse relationship.
The real issue isn’t there anyway. It’s probably going to show up in pension fund rebalancing. With long rates above 5%, pension funds are now likely to cut back on risky assets, either to get back to their target allocations or to lock in their funding position. And that flow could be what actually weighs on equities.



Sumitomo Mitsui DS Asset Management (SMDS AM) ont bien liquidé l’intégralité de leurs avoirs en obligations d’État françaises. Le montant exact n’a pas été divulgué.
(sortie complète, confirmée le 2 octobre 2026.)
Les produits de la vente ont été réalloués vers des Bunds allemands et des obligations d’État japonaises à court terme.
Des hedge funds (Taula, Balyasny) auraient aussi dénoué des carry trades sur la dette française. Nissay AM juge les obligations françaises difficiles à acheter même à bas prix, mais n’a pas pris de décision ferme de vendre.

Derivatives Trading retweeted
C’est juste.
Cependant déclencher une crise de la dette en Europe pourrait fixer ça. (Oui ça peut être perçu comme complotiste)


Great but, european diesel demand runs at roughly 3–4 million barrels/day, meaning the diesel tranche alone would cover approximately 12–17 days of EU diesel consumption.
#OOTT


Start with the wall. 7.69 trillion of Treasuries roll this year. Most of the bulk is already done, but the real point lands November 4 with the quarterly refunding. Nudge the coupon auction sizes even a little and you have just told the market the weight is going up. Then 2027, 6.42 trillion, the peak rollover year, full exposure. 2028 is the first year you get real relief at 3.98 trillion. And you are running a deficit near 6% of GDP, so fresh issuance keeps stacking on top of the rollover. No pause button.
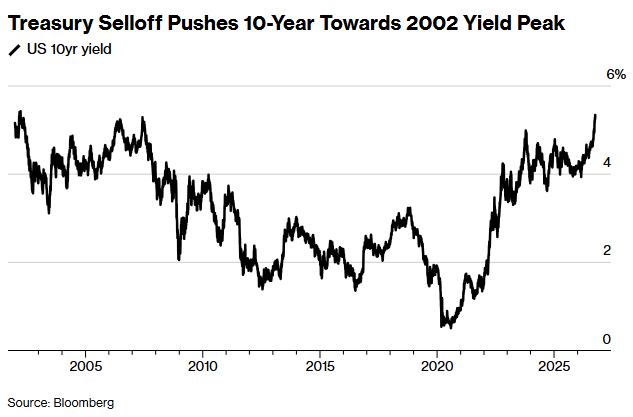
Now the price of carrying it. The 10Y printed 5.30% today, the highest in 24 years. The 30Y sits at 5.64%. What should worry you is the speed. The 10Y is up 108 basis points in six months and it accelerated into quarter end. Every basis point you add is a bigger interest bill on that 7.69 trillion, and there is no arguing with that math.
The buffer that used to smooth all of this is gone. The RRP, your parking lot, is down to 11.5 billion from a 105.9 billion peak, drained 76.5%. That was the shock absorber in the system, and it is empty. Fed funds back at 4% after hiking again in September, balance sheet barely shrinking at 6.75 trillion. Nothing left in the pipes to soak up a bad auction.
Then the buyers. Foreign holdings peaked at 9.49 trillion in February and have bled to 9.25 trillion, 240 billion out in seven months, and the trend turned negative right when you need them most. The marginal foreign bid is not showing up. Put Brent up 42% on the quarter on top and the inflation picture you were leaning on thins out too.
So here is the setup into November 4. A record maturity wall rolling at the highest yields in a generation, no buffer left, foreign demand fading, and one discrete event that can only add weight.
$TLT $TNX $ZB_F $DXY $CL_F
À nos étudiants :
C’est un trader qui est derrière 😂


