

Lead Investor & Prop Desk Trader | FA & TA | Founder-Nimblr TA Open Source (on Blog) Candlesticks & CCI Master
Mumbai, India
Joined June 2015
- Tweets121K
- Following1.8K
- Followers84.2K
- Likes54.5K


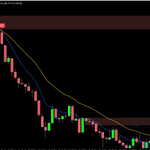





While everyone is watching Nifty fall,
I want to know which stocks are preparing to rise.
- - - - - - - - - - - -
Because even in a falling market, some stocks quietly form a base and start breaking above resistance.
But finding them across hundreds of charts is exhausting.
So I built Bottom Base Breakout Scanner to shortlist these automatically.
Releasing soon..
#stockstowatch

#GoodMorning
If you want to become a trader, stop saying
“I’m busy today. I’ll start next week.”
The market won't wait for your schedule.
Whether you trade intraday, swing or positional, opportunities favour those who are prepared to recognise them.
Build your own watchlist.
Keep updating it.
Track stocks before they breakout.
Know your levels before the opportunity arrives.
You don't have to trade every day.
But you should always be prepared when the right setup appears.
Preparation creates opportunity. Execution turns it into a trade.


Such days have come in the market that no stock qualified for
1 & 3 Year Breakout shortlisting on the Multi year Breakout Dashboard today.
#stockstowatch


ema cross access: tradingview.com/script/J2q1p…

Markets and stocks are pretty flat in mid sessions.
It has a high probability of coming to support rather than gaining momentum nowadays.
Refrain yourself from entering trades mid-session.
You may tend to get trapped in price.
Either find a good entry in the morning session or towards closing.


Last 15units left.. 15 gone already.
Get your 15 days access and test this indicator.. before it runs out of stock..
Get 15 days of access to the Nimblr EMA Trend Indicator
Here's what you can explore on your own TradingView charts:
→ EMA 9 & 21 Crossover to track trend shifts
→ CCI 34 Dashboard across 1H, Daily & Weekly
→ A structured way to read trends with less chart noise
Don't commit to a longer plan just to find out if the indicator fits your trading style.
Use these 15 days to explore it yourself. Then decide.
Valid ONLY UNTIL TONIGHT.
👇 CLICK THE LINK BELOW & CLAIM YOUR ACCESS NOW.
Silver was sliding.
Did your chart help you spot the trend?
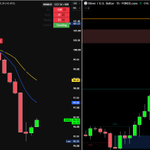
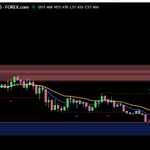
On XAGUSD, Nimblr EMA Cross Indicator highlighted the downside trend before price moved towards the $56 support zone.
The indicator didn't predict the target.
It helped identify the trend direction; price action showed how the move unfolded.
Here's how I use it:
→ EMA 9/21 crossover to track trend shifts
→ CCI 34 dashboard for multi-timeframe context
→ Support and resistance to assess key price zones
The goal isn't to predict every candle.
It's to recognise the trend and track what price does next.
#tradingview


Get 15 days of access to the Nimblr EMA Trend Indicator
Here's what you can explore on your own TradingView charts:
→ EMA 9 & 21 Crossover to track trend shifts
→ CCI 34 Dashboard across 1H, Daily & Weekly
→ A structured way to read trends with less chart noise
Don't commit to a longer plan just to find out if the indicator fits your trading style.
Use these 15 days to explore it yourself. Then decide.
Valid ONLY UNTIL TONIGHT.
👇 CLICK THE LINK BELOW & CLAIM YOUR ACCESS NOW.
