

The definitive name in financial market timing and analytics for over 50 years. All content is informational and not to be construed as investment advice.
Scottsdale, AZ
Joined March 2014
- Tweets199
- Following13
- Followers11.7K
- Likes21
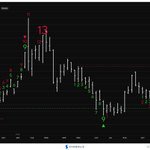



$GLD has remained under pressure much of this year after recording a weekly 13 Sell Countdown near its all-time highs.
The more recent rally in August failed just shy of its TDST upside resistance level of $437.42. The market is now trading into the weekly TDST downside of $374.19 and the daily TDST downside of $368.64.
These levels have held well for months and remain critical in determining whether the gold ETF will find meaningful support or continue its decline until subsequent 13 counts can be recorded.


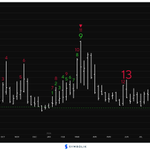
The weekly and monthly $VIX charts are unfolding in an interesting way. The price is trading above the weekly downside TDST of $14.49, which has held the past five months and remains a key support level to watch.
Meanwhile, it’s possible the monthly chart could record a 13 Sequential Buy Countdown as early as the end of this month. If everything remains aligned, it would paint a compelling picture.


$DXCM completed a 13 Sequential Sell Countdown and a D-Wave 5 on August 14, with the D-Wave sequence originating from the November 2025 low. Focus now shifts to the D-Wave A requirements following a bearish price flip.
Confirmation would align with the 13 Sell Countdown and support a potential trend reversal. Failure to meet the D-Wave corrective wave requirements would instead favor trend continuation. Sequential Sell Risk Level resistance is at $94.50.

$FLY recorded a perfected Combo Sell Setup 9 yesterday, highlighting potential upside exhaustion. Price is currently trading between the upside TDST of $29.75 and the downside TDST of $17.84, forming a well-defined trading band. In examples like these, we look for a a qualified breakout of this band to help determine the next trend direction.

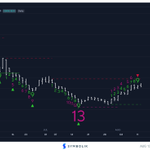
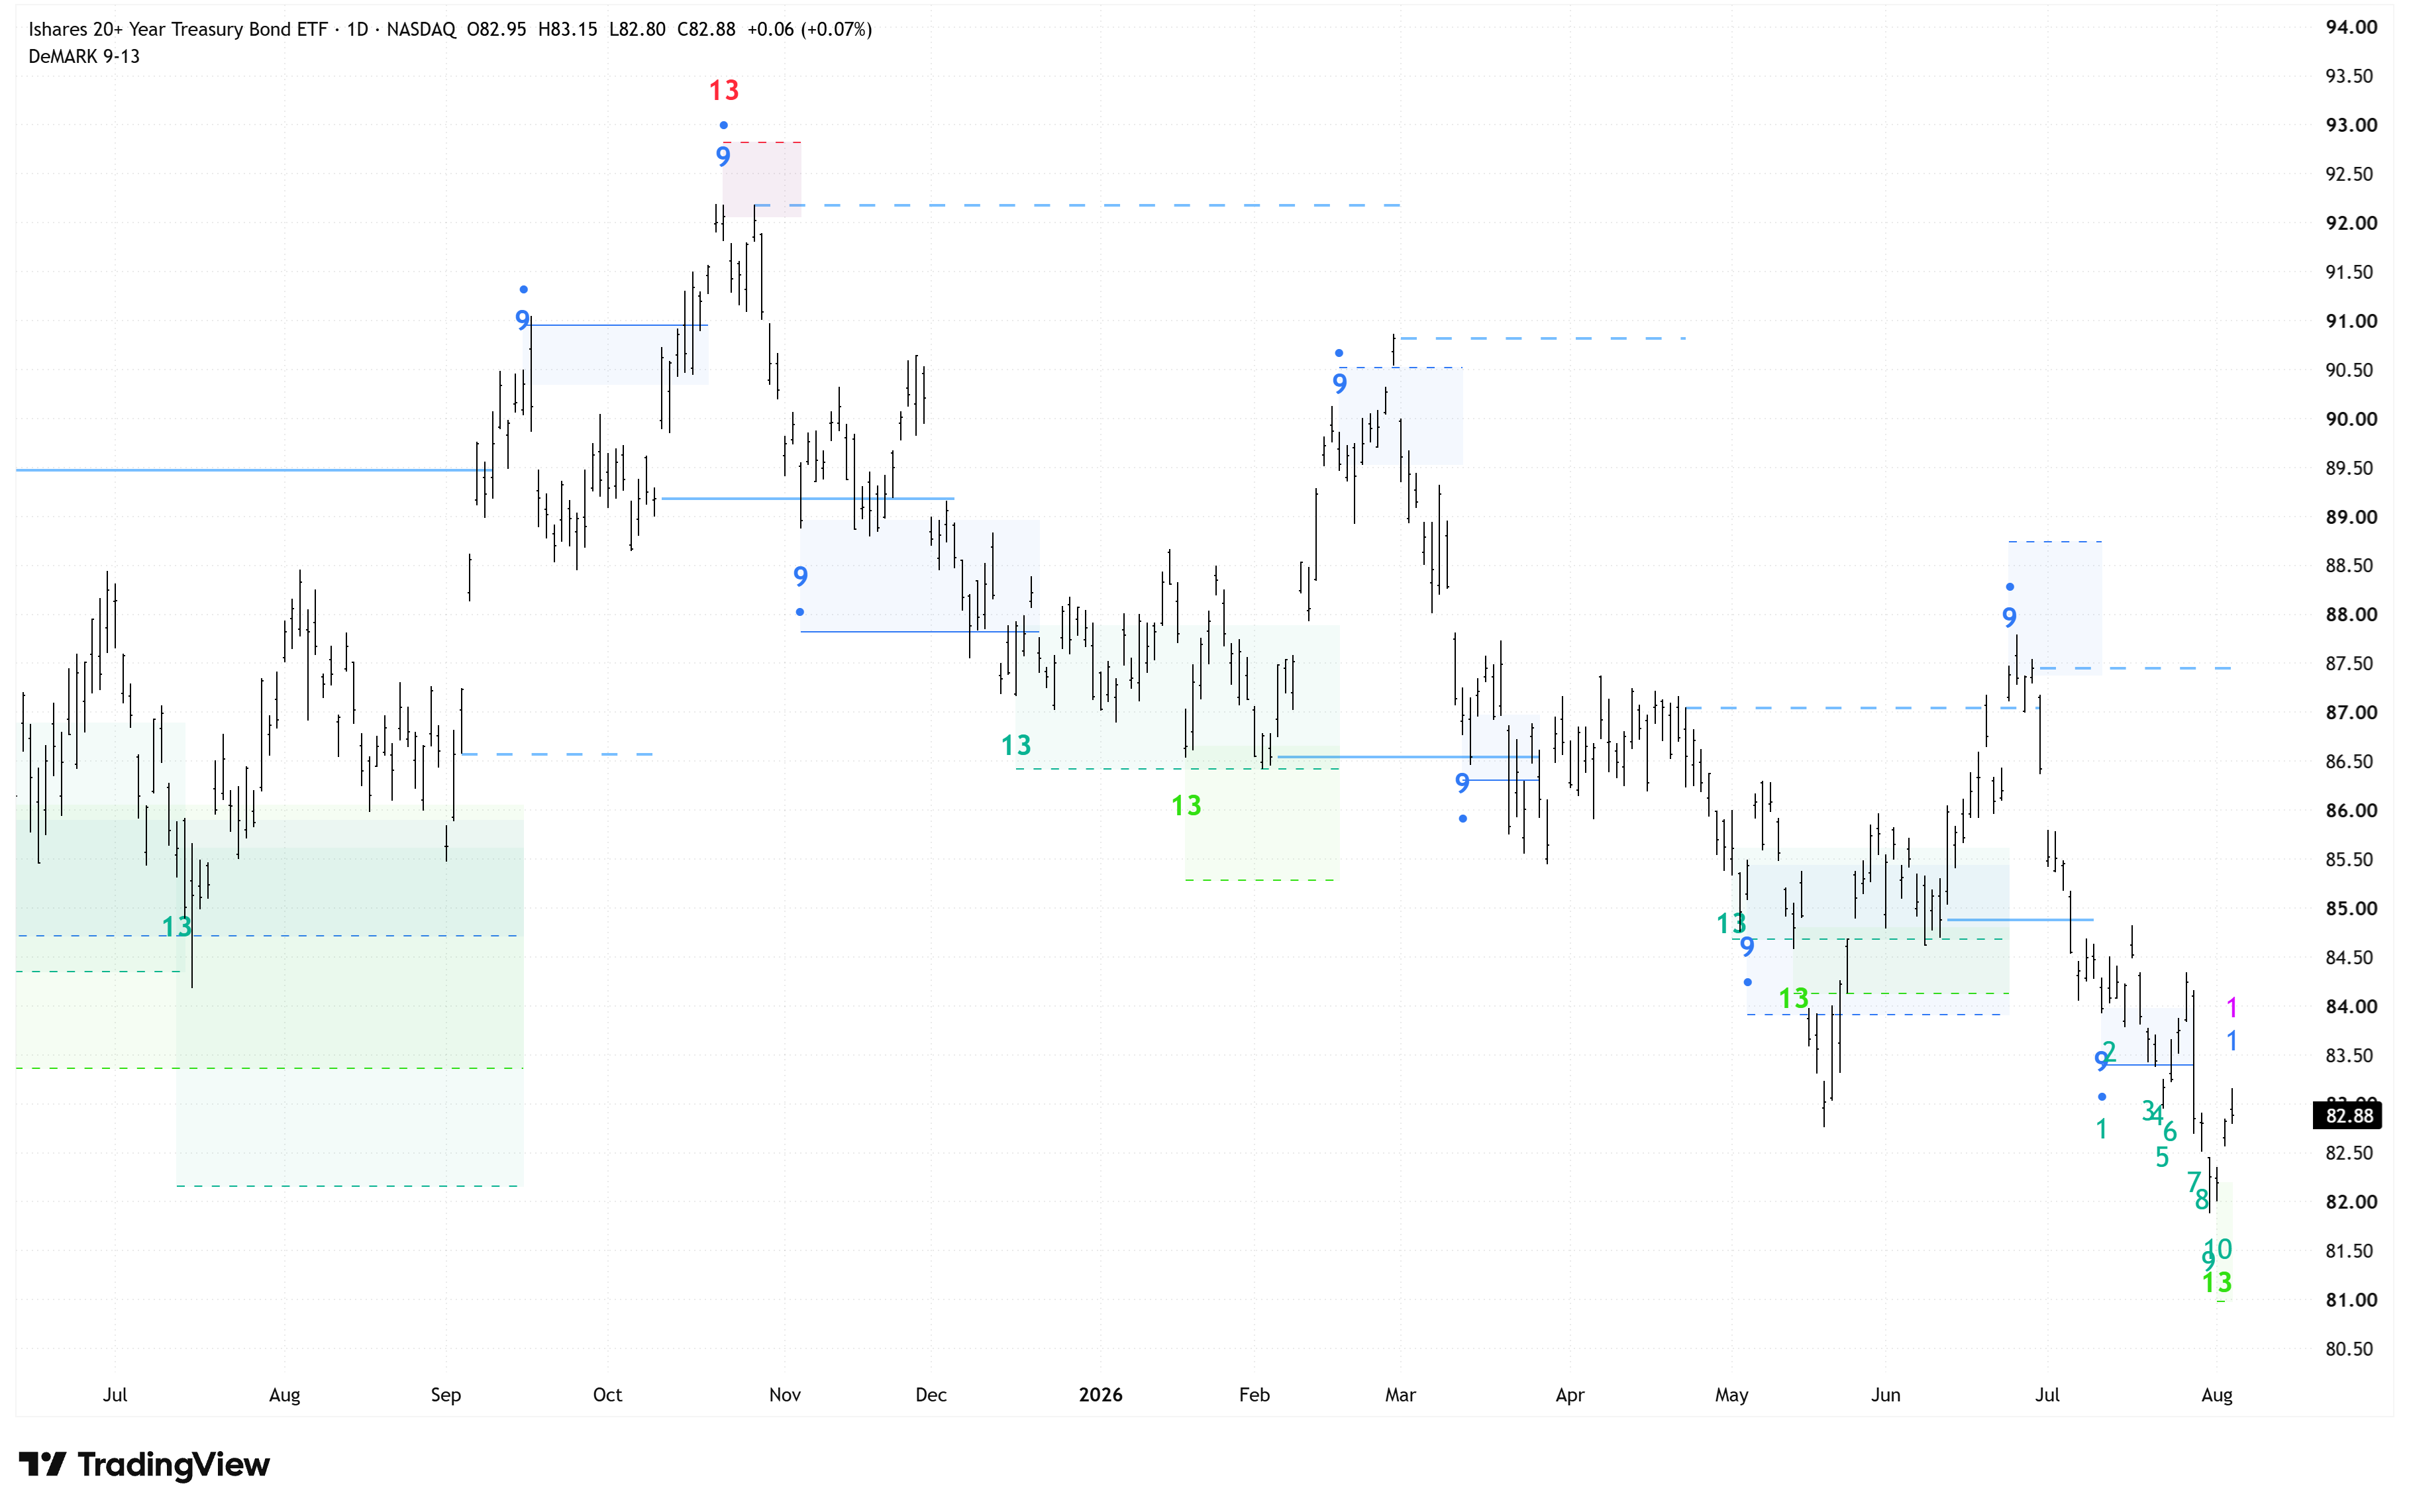
$TLT completed a 13 Combo Buy Countdown on the daily chart, with Sequential trailing a few bars behind at a 10. Aligning these two daily indications would suggest potential downside exhaustion.
A completed daily Sequential Buy Countdown may also increase synchronicity with the weekly indications, with the weekly Risk Level of $79.44 serving as a key downside reference point.
The daily 13 Buy Countdown in $AMGN in May successfully identified an exhaustion low, with the subsequent rally carrying price to the upside TDST level of $377.64 and the Propulsion price objective of $381.28.
The current TDST penetration has not yet qualified, but doing so would suggest continued strength — the degree of which could be tempered by the weekly Sell Countdown, presently running between an 11 or 13, depending on the settings used. Should that weekly count be fulfilled, the subsequent 12 weekly price bars would be key in determining whether upside momentum can persist.


$GOOGL completed an imperfected Sequential Buy Setup 9 on the daily chart, following the recent 13 Sell Countdowns. Setup Perfection requires a trade below $314.91.
Meanwhile, TDST support at $335.39 is the key level to monitor. A qualified and confirmed downside breakout would reinforce the case for potential continued bearish momentum.

$TMO's current weekly bar has perfected a Sequential Sell Setup 9, suggesting the potential for a pause in upside momentum over the next 1-4 weeks. Shares have rallied 32.53% from their May 17, 2026 low, where TDST support held. Watch TDST resistance at 633.65 closely, as a qualified and confirmed breakout would support the case for further trend continuation.

$GLD recorded a daily Combo Buy Countdown 13 on July 16, closing at $364.97. Now 3 bars into the 12-bar metric window following the indication, GLD is trading at $374.29. Watch for signs of stabilization versus renewed downside momentum. The Buy Risk Level is the key reference point.

$KO recorded a daily Sequential Sell Countdown 13 yesterday. The next 12 bars should be monitored for signs of potential trend exhaustion or continued upside momentum. The Risk Level at $88.38 is now the key reference point for upside pressure.
A break and downside follow-through below TDST support at $79.97 would cancel the active Sell Countdown associated with the Sell Setup 9 on July 9 and increase the potential for downside momentum.

$TLT completed a weekly Sequential Buy Countdown 13 today, indicating potential downside exhaustion. It's currently trading at $84.01 and confirmation of a trend shift would require a weekly close above the close from four weeks prior, measured on a rolling basis. Since December, the price has remained within disqualified TDST resistance at $90.64 and support at $85.48.

$RTX completed a Perfected Sequential Sell Setup 9 yesterday, indicating the potential for a 1 to 4-bar correction. The stock is currently trading at $194.47, 4.82% below TDST resistance at $204.31 and 5.40% above TDST support at $184.50. Watch these levels for a potential breakout.

$ARKK remains above its weekly Buy TDST of $72.44, suggesting the prior downside reference level has held as support. The chart previously recorded a 13 Combo Sell Countdown near the October 2025 high.
The current price is approximately $82.58, with the next important upside reference being the Imperfected Sell Setup at $92.65. The $72.44 TDST line remains a key downside level to monitor.

DeMARK Analytics retweeted

We just launched an all-new website, showcasing many of Symbolik's most powerful features. We’ve also revamped the account portal, so users can manage their profile, login, subscriptions, billing and payment from any page outside the platform.
symbolik.com/

Congratulations to the winners of our giveaway:
🔸Essential: @aschieferer
🔸Plus: @ansom_io
🔸Premium: @nilspetersen
🔸Ultimate: @SliceofMarkets
Please DM us within 24 hours with your TradingView username to claim your prize.

DeMARK is now available on @TradingView and we're giving away 4 free annual Superchart plans 🏆
Prizes:
🔸Essential
🔸Plus
🔸Premium
🔸Ultimate
To enter:
1⃣ Follow @DeMarkAnalytics
2⃣ Like this post
3⃣ Repost
Winners will be announced on April 27.

All @TradingView users can access DeMARK 9-13® for the same insights trusted by the world's top market professionals for decades.
tradingview.com/spaces/DeMAR…

Measure momentum and exhaustion and anticipate reversals with DeMARK 9-13®, a streamlined version of the Sequential® and Combo® family of studies — now on @TradingView.
tradingview.com/spaces/DeMAR…
We’re also giving away 4 free annual TradingView plans.
Enter via the post below ⬇️
DeMARK is now available on @TradingView and we're giving away 4 free annual Superchart plans 🏆
Prizes:
🔸Essential
🔸Plus
🔸Premium
🔸Ultimate
To enter:
1⃣ Follow @DeMarkAnalytics
2⃣ Like this post
3⃣ Repost
Winners will be announced on April 27.
DeMARK is now available on @TradingView and we're giving away 4 free annual Superchart plans 🏆
Prizes:
🔸Essential
🔸Plus
🔸Premium
🔸Ultimate
To enter:
1⃣ Follow @DeMarkAnalytics
2⃣ Like this post
3⃣ Repost
Winners will be announced on April 27.
DeMARK Analytics retweeted
Celebrate the first day of April with the release of our all-new Vintage theme. Step back in time with a nostalgic nod to the markets:
symbolik.com/platform

The Sequential® and Combo® studies sometimes precede significant news events. In this case, the 1-minute E-Mini futures chart recorded a 13 Combo buy Countdown® indication approximately 15 minutes before yesterday's announcement of potential discussions with Iran, resulting in a 200+ point E-Mini rally in the span of just six minutes.
