

Finding (open) data and transforming it to information. Also: https://xitter.cf/t.co/Ayz8W9C776 @Datagraver@Mastodon.social
- Tweets4K
- Following4.3K
- Followers11.8K
- Likes990





ALT Grafiek met gemiddelde leeftijd bij eerste huwelijk in Nederland, uitgesplitst naar man en vrouw, vanaf 1950. Start op 28 voor man en 25,6 voor vrouw in 1950. Vanaf dat moment dalend. In 1973 gemiddeld op 24,6 voor man en 22,6 voor vrouw. Vanaf dat moment stijgend. Nu op 35,0 voor man en 32,9 voor vrouw.

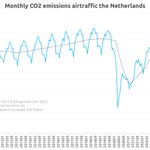
ALT Graph showing monthly co2 emissions (thousands of tonnes) by airtraffic in the Netherlands, since 2010. It follows a seasonal pattern, with a peak in August and a bottom in February. The 12 month average trend goes from 800 thousend tonnes co2 in 2010 to 920.000 in 2019. It then drops to 500 thousend tons during Corona. Now it is back up at 880 thousand tonnes.

ALT Graph showing government shutdowns by date and duration, combined with the presidential terms USA. Data Start Days 30-09-1976 10 30-09-1977 12 31-10-1977 8 30-11-1977 8 30-09-1978 18 30-09-1979 11 20-11-1981 2 30-09-1982 1 17-12-1982 3 10-11-1983 3 30-09-1984 2 03-10-1984 1 16-10-1986 1 18-12-1987 1 05-10-1990 3 13-11-1995 5 15-12-1995 21 30-09-2013 16 19-01-2018 3 09-02-2018 1 9 hours 22-12-2018 35 01-10-2025 18

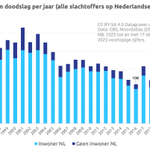
ALT Grafiek telling moord en doodslag in NL (alle slachtoffers, inwoners en niet-inwoners) per jaar vanaf 1992. Hoogste waarde in 1995 met 269. Daarna daling met als laagste waarde 108 in 2016. Daarna schommelt het rond de 120. 2023: 125 2024: 120 De lopende telling voor 2025: 90

ALT Graph with monthly world temperature anomalies compared to the 1951-1980 average, since 1850, plus a 10 year centered average. This has gone from -0.3 around 1900 to +1.0 now.

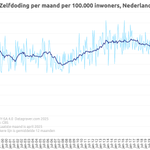
ALT Grafiek met aantal gevallen van zelfdoding per maand per 100.000 inwoners in Nederland vanaf 1995, plus een lopend 12 maands gemiddelde. In de periode 1995-2005 lag het gemiddelde op 0,8. Daarna een korte dip naar 2008 met 0,7 per maand. Om vervolgens weer voorzichtig te stijgen tot net boven de 0,9 vanaf 2013. Dit niveau bleef tot in 2019, waarna er weer een daling is tot iets onder de 0,9 waar het nu nog steeds zit.

ALT Graph showing government shutdowns by date and duration, combined with the presidential terms USA. Data Start Days 30-09-1976 10 30-09-1977 12 31-10-1977 8 30-11-1977 8 30-09-1978 18 30-09-1979 11 20-11-1981 2 30-09-1982 1 17-12-1982 3 10-11-1983 3 30-09-1984 2 03-10-1984 1 16-10-1986 1 18-12-1987 1 05-10-1990 3 13-11-1995 5 15-12-1995 21 30-09-2013 16 19-01-2018 3 09-02-2018 1 9 hours 22-12-2018 35 01-10-2025 17

ALT Grafiek aantal keer dat per week bij Openbaar Vervoer ingecheckt wordt, vanaf 2019. Gemiddelde tot begin 2020 lag op 25 miljoen. Daarna door lockdown Corona terugval tot onder 5 miljoen in eerste kwartaal 2020. Het jaar gemiddelde zakte naar 10 miljoen. Sindsdien langzame stijging tot nu 23 miljoen per week gemiddeld halverwege 2024 waarna het min of meer stabiel bleef.

ALT Graph with number of Israeli and Palestinians killed in the conflict between Israel and Palestine, per year from 1987 onward, next to each other. The number of Palestines killed always outnumber the number of Israeli, except in 1996. The most significant years are 2001 to 2009, 2014 and now 2023 and 2024. 2024 shows 257 Israeli deaths and 24145 Palestinian deaths. 2025 shows 91 Israeli deaths and 22591 Palestinian deaths. Total numbers in this graph, 81087 Palestinians killed and 3388 Israeli. Data source: B'Tselem, OCHA and Wikipedia Oct-Dec 2023 and years 2024 and 2025 unverified for Gaza. Only fully identified casualties till Oct 2023 for all territories, and Oct-2023 till Feb-2025 for all territories except Gaza, plus Ocha data West Bank Aug-2024 till July 2025.

ALT Graph showing per day the total amount of public debt outstanding in the USA in billions of dollars, plus dividers for the era's per president. It starts at 4175 and is now at 37920. Only the first period saw a relative slow growth from 4200 to 5700, under Clinton. Datasource: https://fiscaldata.treasury.gov/datasets/debt-to-the-penny/debt-to-the-penny

ALT Graph showing government shutdowns by date and duration, combined with the presidential terms USA. Data Start Days 30-09-1976 10 30-09-1977 12 31-10-1977 8 30-11-1977 8 30-09-1978 18 30-09-1979 11 20-11-1981 2 30-09-1982 1 17-12-1982 3 10-11-1983 3 30-09-1984 2 03-10-1984 1 16-10-1986 1 18-12-1987 1 05-10-1990 3 13-11-1995 5 15-12-1995 21 30-09-2013 16 19-01-2018 3 09-02-2018 1 9 hours 22-12-2018 35 01-10-2025 16

ALT Grafiek met twee lijnen met telling aantal geregistreerde volledig elektrische auto's en plug in hybride auto's sinds begin 2014 in Nederland. In het begin snelle groeit plugin hybride. In 2019 haalt full electric de hybride in. Nu lijkt de groei van full lineair maar is er een versnelling in hybride. Aantal full nu 634.000, aantal plug in hybride 482.000.

ALT Graph with count of signed executive orders per presidential term as function of days in office, for presidents since Eisenhower. Lowest line is GW Bush 2 ending at 118. Highest so far is Carter with 320. But the current term for Trump (only 269 days so far) jumps out because of the steep upward curve to now already 210.

ALT Grafiek met aantal opgelegde stadionverboden (door rechter) sinds seizoen 2005/2006. Data: Seizoen Aantal 2005-2006 833 2006-2007 676 2007-2008 769 2008-2009 741 2009-2010 641 2010-2011 333 2011-2012 601 2012-2013 662 2013-2014 572 2014-2015 890 2015-2016 579 2016-2017 569 2017-2018 491 2018-2019 595 2019-2020 420 2020-2021 133 2021-2022 1342 2022-2023 1086 2023-2024 1100 2024-2025 824

ALT Grafiek belminuten per kwartaal vanaf 2015, Nederland. Belminuten vast (inclusief voip) start op 4,2 miljard en zit nu pp 0,9 miljard per kwartaal. Belminuten via mobiel startte op 6,8 miljard, kende een piek in 2021 met 13,1 miljard en zit nu op 8,5 miljard (redelijk stabiel)

ALT Grafiek met deel van volwassen bevolking Nederland geregistreerd in donorregister. Data Jaar Ja Nee Iemand anders beslist Geregistreerd (status onbekend) 2004 37% 2005 0% 2006 0% 2007 39% 2008 42% 2009 42% 2010 43% 2011 43% 2012 43% 2013 26% 12% 5% 2014 26% 12% 5% 2015 27% 12% 5% 2016 27% 13% 5% 2017 26% 13% 5% 2018 27% 14% 5% 2019 27% 17% 6% 2020 33% 24% 7% 2021 34% 31% 10% 24% 2022 34% 31% 10% 25% 2023 33% 30% 10% 27% 2024 33% 30% 10% 28% 2025 32% 29% 10% 28%

ALT Graph showing government shutdowns by date and duration, combined with the presidential terms USA. Data Start Days 30-09-1976 10 30-09-1977 12 31-10-1977 8 30-11-1977 8 30-09-1978 18 30-09-1979 11 20-11-1981 2 30-09-1982 1 17-12-1982 3 10-11-1983 3 30-09-1984 2 03-10-1984 1 16-10-1986 1 18-12-1987 1 05-10-1990 3 13-11-1995 5 15-12-1995 21 30-09-2013 16 19-01-2018 3 09-02-2018 1 9 hours 22-12-2018 35 01-10-2025 15

ALT Graph with monthly world temperature anomalies compared to the 1991-2020 average, since 1891, plus a 10 year moving average. This has gone from -0.8 beginning of 1900 to +0.35 now.

ALT Grafiek met (officiële) aantal zwangerschapsafbrekingen per jaar in Nederland. Start in 1985 op 37.000, zakt dan onder de 30.000 in 1998, gevolgd door opleving richting 35.000 in 2003 Daarna lang geleidelijke daling tot rond de 30.000 in 2016-2021. Dan snelle stijging tot 39.000 in 2023.