

Led by @George_Khalaf, we're an analytics & survey firm crafting data-driven solutions for our clients. Top 10 pollster in America by @FiveThirtyEight.
Phoenix, AZ
Joined August 2016
- Tweets1.3K
- Following917
- Followers17.5K
- Likes299




ARIZONA BY COUNTY | October 23 update
Gila’s party turnout is nearly even: 27.1% Republican and 27.8% Democratic.
But Republicans lead returned ballots by 2,762, or 30.4%, reflecting their larger registration.
Both measures for all 15 counties. 🧵


Data Orbital retweeted

Are Republicans returning more ballots compared to 2022, 2024 and compared to the Democrats? Is there a blue wave coming for Arizona? @Data_Orbital President @George_Khalaf, also running for State Rep LD-3 breaks down the numbers.
ARIZONA EARLY VOTING | October 23 update
841,534 ballots returned. Democrats lead by 1,357 ballots—a 0.2% advantage, versus 3.0% at the comparable point in 2022.
Overall turnout is 18.5%, compared with 18.7% in 2022.
The statewide breakdown. 🧵


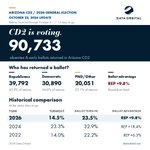
TODAY’S SPOTLIGHT: CD2 | October 22
90,733 early ballots returned. Republicans lead by 8,902 ballots—a 9.8% advantage, versus 6.3% at the comparable point in 2022. 🧵
County reporting schedules vary; Apache and Navajo returns are through Oct. 16.


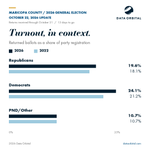
Maricopa’s PND/Other turnout is essentially level with its 2022 pace at 10.7%.
Republican turnout is 19.6%, versus 18.1% in 2022. Democratic turnout is 24.1%, versus 21.2%.
Among Maricopa voters with no participation in the previous four general elections, returns are spread closely across parties:
Republicans: 5,916
Democrats: 6,795
PND/Other: 6,800


MARICOPA COUNTY | October 22 update
452,819 early ballots returned. Democrats lead by 2,278 ballots—a 0.5% advantage, versus 1.6% at the same point in 2022.
Overall turnout is 17.5%.
Three charts on the county’s early-voting picture. 🧵

ARIZONA BY COUNTY | October 22 update
Republicans lead returned ballots in nine counties; Democrats lead in six.
But county totals vary widely. Across all 15, Democrats hold a 6,136-ballot advantage, or 0.8%.
Maricopa and Pima both show 24.1% turnout among registered Democrats.
Republican turnout is 19.6% in Maricopa and 17.1% in Pima. PND/Other turnout is 10.7% and 10.8%, respectively. 🧵


Some legislative districts have narrow gaps in returned ballots.
Democrats lead by 249 ballots in LD2 and 442 in LD16. Republicans lead by 375 in LD13 and 604 in LD4.
LD28 has 43,959 returned ballots. Participation within each party’s registration looks like this:
Republicans: 26.0%
Democrats: 39.7%
PND/Other: 19.2%


ARIZONA EARLY VOTING | October 22 update
737,184 ballots returned. Overall turnout is 16.2%, matching 2022 at the comparable point.
The party mix differs: Democrats hold a 0.8% ballot advantage, versus 3.3% in 2022.
The statewide breakdown. 🧵

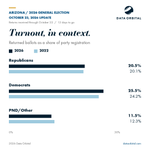
Similar overall turnout, different participation by party.
Republicans: 17.8% vs. 17.4% in 2022
Democrats: 22.6% vs. 21.2%
PND/Other: 10.0% vs. 10.7%
The chart compares returned ballots as a share of each party’s registration at matching days to go.

Similar overall turnout, different participation by party.
Republicans: 17.8% vs. 17.4% in 2022
Democrats: 22.6% vs. 21.2%
PND/Other: 10.0% vs. 10.7%
The chart compares returned ballots as a share of each party’s registration at matching days to go.
3/3 — Voting history
More than half a million returned ballots come from voters who participated in all four previous general elections.
That group accounts for 502,514 returns—68.2% of the statewide total.
Here’s how the counts and return rates compare across voting-history groups.

MARICOPA COUNTY | October 21 update
383,548 early ballots returned. Democrats lead Republicans by 3,042 ballots—a 0.8% advantage.
Turnout is 14.8%, versus 13.7% at the same point in 2022.
Three charts on the county’s early-voting picture. 🧵

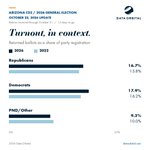
More than one in five registered Maricopa Democrats has voted early.
Current turnout:
Republicans: 16.6%
Democrats: 20.5%
PND/Other: 9.0%
All three groups remain ahead of their 2022 rates at matching days to go.


ARIZONA BY COUNTY | October 21 update
Pima gives Democrats a 24,220-ballot advantage. Yavapai and Mohave give Republicans advantages of 8,739 and 8,654 ballots.
Statewide, Democrats lead by 7,441.
The county-by-county counts and margins. 🧵

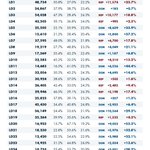
The largest raw Republican ballot advantage among Arizona’s LDs is in LD30: 9,563 ballots.
The largest Democratic advantage is in LD18: 8,258.
This table shows total returns, party shares, and ballot advantages across all 30 districts.

