

Futures trader using order flow and technical analysis | Dad of 3 | Philippians 4:13
Daily Livestream
Joined October 2021
- Tweets1.4K
- Following96
- Followers3K
- Likes1.2K




Pinned Tweet
Every tool on my ES/NQ chart, and exactly how I use it.
People always ask what's on my screen. Here's the full breakdown. Nothing fancy, everything has a job.
Context → Location → Confirmation → Execution 👇
A thread 🧵
GEX Levels
My areas of interest. Call walls and put walls show where dealer hedging can slow or reverse price.
• Call wall = I look for rejections.
• Put wall = I look for bounces.

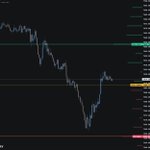
GEX CALL WALL + BUYERS ABSORPTION📉
Caught this short on the livestream today.
If you’ve ever wanted to see buyer absorption play out in real time — and exactly how the short was initiated off it — today’s video is worth watching.


Step by step walkthrough of how I took this #ES_F short.

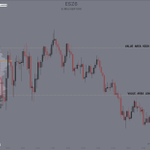
GEX CALL WALL + LAAF SETUP📉
Caught 18 points on #ES_F short with the team today!
Trade Breakdown:
• Spotted GEX CALL WALL @ 7760 which coincides with RTH VAH level
• Saw large buy side delta between 7760-7765 where price immediately rejected and traded back below the CALL WALL @ 7760 (see footprint chart for visual)
• This can be viewed as a look above and fail setup where buyers comes in at breakout area and fail to sustain value above.
Took a lot of patience on this trade. Walked the community through step by step from entry to exit. Much needed win this week.
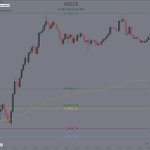
#ES_F : Really lacking conviction with price continuing to range within these zones.
🟢 IF we can build value back above 7770-7775, THEN I'm favoring longs targeting 7810-7820 supply.
🔴 IF we find acceptance below 7745-7750, THEN I'm favoring shorts first targeting 7725-7730 with a final target at 7700-7710.

Appreciate everyone who’s been using my code for TheGexLab!💙
If you signed up with my code, just shoot me a DM and I’ll get you into my discord.
I don’t partner with tools I haven’t actually used.
I’ve gone through a lot of GEX platforms. Most of them are cluttered or hard to read. THEGEXLAB is the one that stuck.
What I like:
• Levels are already converted to ES, NQ, and GC — no mental math from SPX/QQQ
• Call wall, put wall, and zero gamma on the chart
• Live positive/negative gamma regime so you know if dealers are damping or accelerating
• Market-generated levels drawn automatically (VAH/VAL, POC, ONH/ONL)
•Clean enough that a beginner can read it without getting lost
I still trade the same way, this just helps map where dealers are likely to defend in confluence with orderflow trading.
20% off with code DAD → thegexlab.com/dad

Buyers Absorption + GEX Call Wall Rejection📉
Right analysis, wrong timing.
Took an L today despite having the right idea. This is the setup I look for on a day to day basis but was being impatient and tried shorting early instead of waiting for the retracement after the rejection.
Not a great way to end the week but overall green for the week.
HAGW 🍻


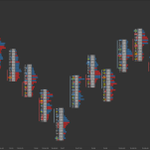
Here's a footprint view of #ES_F on how I use orderflow as confirmation in confluence with GEX CALL WALL Rejection.
- Price took out ORB-H (7740.75) and immediately traded back below
- Once the call wall at 7745 rejected, it printed 1k delta buy imbalance (this can be viewed as buyers potentially becoming trapped given that price traded lower right after)
- After printing large delta imbalance, it was followed by large aggressive selling (1k delta sell imbalance)
- That was the confirmation of the entry short.
Location -> GEX CALL CALL
Confirmation -> Orderflow


GEX Call Wall + Buyers Absorption 📉
Took multiple tries but was able to catch ES short using GEX Level as area of interest then using orderflow as confirmation to spot trapped participant.
Hard to see the buyers absorption followed by aggresive selling on a basic candlestick chart so here's the Footprint view.

