

High-timeframe crypto analysis. Daily charts here, deep dives on YouTube, full setups in PRO CAPITAL 👇 Trading since 2020. NFA
Joined December 2024
- Tweets2.9K
- Following628
- Followers1.3K
- Likes5.9K





$AERO 🛫

@CryptoYieldPro is flying with us. Pass attached.

ALT An Aero boarding pass issued to Crypto Yield Pro (@CryptoYieldPro, verified), seat 14311, from Anywhere, Oct 2026.

11.8K monthly paying users on Sonic, up from ~7.5K in August.
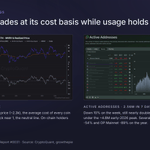
Active addresses still sit near 14K, from ~50K a year ago.
The users who pay are coming back first. That's the one $S number I said to watch in September.

What else is turning on Sonic $S, and what isn't: youtu.be/BLtnoD1sRkA
Every coin, its size and where each trade stands is in my members' portfolio, updated every time I move:
youtube.com/channel/UCLOR_Dd…
$1B left the spot $ETH ETFs in 3 straight red weeks.
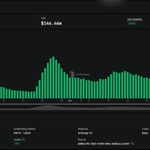
Over the same stretch, Ethereum slid onto its realized price, the average cost basis of every coin on the network. MVRV is back near 1.
Institutions are selling right where on-chain holders break even.

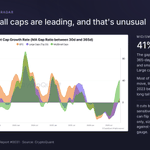
41% vs 7%.
That's the gap between the 30-day and 365-day average market cap for mid and small caps, against Bitcoin's. Large caps sit at 3.5%.
Usually $BTC leads the way out of a bear, like it did in 2023. Since late August, the long tail went first.

Where the second zone sits, what the missing audit means for Sonic, and the $S yield play that can fill it for you: youtu.be/BLtnoD1sRkA
2 targets hit since my September $S entry, and 60% of the bag is still riding.
Sonic broke its 2025 descending channel, spiked on audit hopes, and is now pulling back into the weekly EMAs where I marked a second zone.
Here's my update. 🧵👇 1/2

~$9M a week. That's what Filecoin lost at its worst in early 2024 on Token Terminal's earnings chart. Now it's a fraction of a million.
Core devs went from 31 in September to 47. $FIL still pays ~$13 in incentives per $1 of revenue, but the bleed is shrinking fast.

The good and the bad of Filecoin $FIL, in one breakdown: youtu.be/ZBXS83GnNms

0.37 PiB a day. That's how much new data Filecoin onboarded daily, down 12% in 30 days.
Filecoin's own simulator needs ~35 PiB a day for $FIL supply to actually shrink. The unlocks ended on Oct 15. The paying demand still has to show up.

40% of every Filecoin block reward gets burned if paying demand never shows up. That's Solstice, live Oct 19.
$FIL broke its 2-year falling wedge in September, then 4 weekly candles stalled under the 55 EMA. No weekly close above it since Dec 2024.
Here's why. 🧵👇 1/2

What Solstice changes, the demand number that's lagging, and how I'm managing my Filecoin $FIL position: youtu.be/ZBXS83GnNms