

Which Chicagoans are getting vaccinated? A daily update bot by @beamalsky & @maerunes for @SouthSideWeekly. Art by @zeldagalewsky. Data notes at link ⤵️
- Tweets482
- Following1
- Followers1.6K
- Likes0
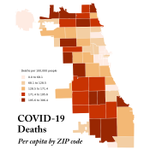



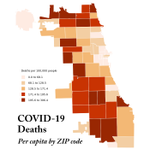

ALT Two maps of Chicago, side by side. The map on the left shows COVID-19 deaths per capita by ZIP code. The map on the right shows completed COVID-19 vaccination per capita by ZIP code. The maps reveal a disconnect between where residents are getting vaccinated and where COVID-19 deaths are concentrated.

ALT Two maps of Chicago, side by side. The map on the left shows COVID-19 deaths per capita by ZIP code. The map on the right shows completed COVID-19 vaccination per capita by ZIP code. The maps reveal a disconnect between where residents are getting vaccinated and where COVID-19 deaths are concentrated.

ALT Two maps of Chicago, side by side. The map on the left shows COVID-19 deaths per capita by ZIP code. The map on the right shows completed COVID-19 vaccination per capita by ZIP code. The maps reveal a disconnect between where residents are getting vaccinated and where COVID-19 deaths are concentrated.

ALT Two maps of Chicago, side by side. The map on the left shows COVID-19 deaths per capita by ZIP code. The map on the right shows completed COVID-19 vaccination per capita by ZIP code. The maps reveal a disconnect between where residents are getting vaccinated and where COVID-19 deaths are concentrated.

ALT Two maps of Chicago, side by side. The map on the left shows COVID-19 deaths per capita by ZIP code. The map on the right shows completed COVID-19 vaccination per capita by ZIP code. The maps reveal a disconnect between where residents are getting vaccinated and where COVID-19 deaths are concentrated.

ALT Two maps of Chicago, side by side. The map on the left shows COVID-19 deaths per capita by ZIP code. The map on the right shows completed COVID-19 vaccination per capita by ZIP code. The maps reveal a disconnect between where residents are getting vaccinated and where COVID-19 deaths are concentrated.

ALT Two maps of Chicago, side by side. The map on the left shows COVID-19 deaths per capita by ZIP code. The map on the right shows completed COVID-19 vaccination per capita by ZIP code. The maps reveal a disconnect between where residents are getting vaccinated and where COVID-19 deaths are concentrated.

ALT Two maps of Chicago, side by side. The map on the left shows COVID-19 deaths per capita by ZIP code. The map on the right shows completed COVID-19 vaccination per capita by ZIP code. The maps reveal a disconnect between where residents are getting vaccinated and where COVID-19 deaths are concentrated.

ALT Two maps of Chicago, side by side. The map on the left shows COVID-19 deaths per capita by ZIP code. The map on the right shows completed COVID-19 vaccination per capita by ZIP code. The maps reveal a disconnect between where residents are getting vaccinated and where COVID-19 deaths are concentrated.

ALT Two maps of Chicago, side by side. The map on the left shows COVID-19 deaths per capita by ZIP code. The map on the right shows completed COVID-19 vaccination per capita by ZIP code. The maps reveal a disconnect between where residents are getting vaccinated and where COVID-19 deaths are concentrated.

ALT Two maps of Chicago, side by side. The map on the left shows COVID-19 deaths per capita by ZIP code. The map on the right shows completed COVID-19 vaccination per capita by ZIP code. The maps reveal a disconnect between where residents are getting vaccinated and where COVID-19 deaths are concentrated.

ALT Two maps of Chicago, side by side. The map on the left shows COVID-19 deaths per capita by ZIP code. The map on the right shows completed COVID-19 vaccination per capita by ZIP code. The maps reveal a disconnect between where residents are getting vaccinated and where COVID-19 deaths are concentrated.

ALT Two maps of Chicago, side by side. The map on the left shows COVID-19 deaths per capita by ZIP code. The map on the right shows completed COVID-19 vaccination per capita by ZIP code. The maps reveal a disconnect between where residents are getting vaccinated and where COVID-19 deaths are concentrated.

ALT Two maps of Chicago, side by side. The map on the left shows COVID-19 deaths per capita by ZIP code. The map on the right shows completed COVID-19 vaccination per capita by ZIP code. The maps reveal a disconnect between where residents are getting vaccinated and where COVID-19 deaths are concentrated.

ALT Two maps of Chicago, side by side. The map on the left shows COVID-19 deaths per capita by ZIP code. The map on the right shows completed COVID-19 vaccination per capita by ZIP code. The maps reveal a disconnect between where residents are getting vaccinated and where COVID-19 deaths are concentrated.

ALT Two maps of Chicago, side by side. The map on the left shows COVID-19 deaths per capita by ZIP code. The map on the right shows completed COVID-19 vaccination per capita by ZIP code. The maps reveal a disconnect between where residents are getting vaccinated and where COVID-19 deaths are concentrated.

ALT Two maps of Chicago, side by side. The map on the left shows COVID-19 deaths per capita by ZIP code. The map on the right shows completed COVID-19 vaccination per capita by ZIP code. The maps reveal a disconnect between where residents are getting vaccinated and where COVID-19 deaths are concentrated.

ALT Two maps of Chicago, side by side. The map on the left shows COVID-19 deaths per capita by ZIP code. The map on the right shows completed COVID-19 vaccination per capita by ZIP code. The maps reveal a disconnect between where residents are getting vaccinated and where COVID-19 deaths are concentrated.

ALT Two maps of Chicago, side by side. The map on the left shows COVID-19 deaths per capita by ZIP code. The map on the right shows completed COVID-19 vaccination per capita by ZIP code. The maps reveal a disconnect between where residents are getting vaccinated and where COVID-19 deaths are concentrated.

ALT Two maps of Chicago, side by side. The map on the left shows COVID-19 deaths per capita by ZIP code. The map on the right shows completed COVID-19 vaccination per capita by ZIP code. The maps reveal a disconnect between where residents are getting vaccinated and where COVID-19 deaths are concentrated.

ALT Two maps of Chicago, side by side. The map on the left shows COVID-19 deaths per capita by ZIP code. The map on the right shows completed COVID-19 vaccination per capita by ZIP code. The maps reveal a disconnect between where residents are getting vaccinated and where COVID-19 deaths are concentrated.

ALT Two maps of Chicago, side by side. The map on the left shows COVID-19 deaths per capita by ZIP code. The map on the right shows completed COVID-19 vaccination per capita by ZIP code. The maps reveal a disconnect between where residents are getting vaccinated and where COVID-19 deaths are concentrated.

ALT Two maps of Chicago, side by side. The map on the left shows COVID-19 deaths per capita by ZIP code. The map on the right shows completed COVID-19 vaccination per capita by ZIP code. The maps reveal a disconnect between where residents are getting vaccinated and where COVID-19 deaths are concentrated.

ALT Two maps of Chicago, side by side. The map on the left shows COVID-19 deaths per capita by ZIP code. The map on the right shows completed COVID-19 vaccination per capita by ZIP code. The maps reveal a disconnect between where residents are getting vaccinated and where COVID-19 deaths are concentrated.

ALT Two maps of Chicago, side by side. The map on the left shows COVID-19 deaths per capita by ZIP code. The map on the right shows completed COVID-19 vaccination per capita by ZIP code. The maps reveal a disconnect between where residents are getting vaccinated and where COVID-19 deaths are concentrated.

ALT Two maps of Chicago, side by side. The map on the left shows COVID-19 deaths per capita by ZIP code. The map on the right shows completed COVID-19 vaccination per capita by ZIP code. The maps reveal a disconnect between where residents are getting vaccinated and where COVID-19 deaths are concentrated.

ALT Two maps of Chicago, side by side. The map on the left shows COVID-19 deaths per capita by ZIP code. The map on the right shows completed COVID-19 vaccination per capita by ZIP code. The maps reveal a disconnect between where residents are getting vaccinated and where COVID-19 deaths are concentrated.

ALT Two maps of Chicago, side by side. The map on the left shows COVID-19 deaths per capita by ZIP code. The map on the right shows completed COVID-19 vaccination per capita by ZIP code. The maps reveal a disconnect between where residents are getting vaccinated and where COVID-19 deaths are concentrated.

ALT Two maps of Chicago, side by side. The map on the left shows COVID-19 deaths per capita by ZIP code. The map on the right shows completed COVID-19 vaccination per capita by ZIP code. The maps reveal a disconnect between where residents are getting vaccinated and where COVID-19 deaths are concentrated.

ALT Two maps of Chicago, side by side. The map on the left shows COVID-19 deaths per capita by ZIP code. The map on the right shows completed COVID-19 vaccination per capita by ZIP code. The maps reveal a disconnect between where residents are getting vaccinated and where COVID-19 deaths are concentrated.

ALT Two maps of Chicago, side by side. The map on the left shows COVID-19 deaths per capita by ZIP code. The map on the right shows completed COVID-19 vaccination per capita by ZIP code. The maps reveal a disconnect between where residents are getting vaccinated and where COVID-19 deaths are concentrated.

ALT Two maps of Chicago, side by side. The map on the left shows COVID-19 deaths per capita by ZIP code. The map on the right shows completed COVID-19 vaccination per capita by ZIP code. The maps reveal a disconnect between where residents are getting vaccinated and where COVID-19 deaths are concentrated.

ALT Two maps of Chicago, side by side. The map on the left shows COVID-19 deaths per capita by ZIP code. The map on the right shows completed COVID-19 vaccination per capita by ZIP code. The maps reveal a disconnect between where residents are getting vaccinated and where COVID-19 deaths are concentrated.

ALT Two maps of Chicago, side by side. The map on the left shows COVID-19 deaths per capita by ZIP code. The map on the right shows completed COVID-19 vaccination per capita by ZIP code. The maps reveal a disconnect between where residents are getting vaccinated and where COVID-19 deaths are concentrated.

ALT Two maps of Chicago, side by side. The map on the left shows COVID-19 deaths per capita by ZIP code. The map on the right shows completed COVID-19 vaccination per capita by ZIP code. The maps reveal a disconnect between where residents are getting vaccinated and where COVID-19 deaths are concentrated.

ALT Two maps of Chicago, side by side. The map on the left shows COVID-19 deaths per capita by ZIP code. The map on the right shows completed COVID-19 vaccination per capita by ZIP code. The maps reveal a disconnect between where residents are getting vaccinated and where COVID-19 deaths are concentrated.