

📈Crypto market clarity for serious spot participants. 🧭 Higher-time-frame context, chart education, and independent judgment. No signals. No hype.
Joined July 2026
- Tweets829
- Following98
- Followers85
- Likes682


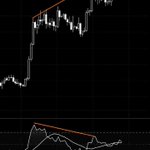
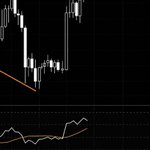




The higher-time-frame structure still allows another move higher, but evidence for consolidation is becoming more visible.
What does your chart say: another leg higher before year-end, or a deeper reset first?
Read the full Monday Market Read on Telegram:
t.me/ChartelCrypto/69
6/6

My bias still leans toward a pullback.
The difference now is that I’m starting to see more evidence supporting it.
Daily upside momentum has moderated, RSI is moving back toward neutral, and CMC Fear & Greed has cooled to 49, Neutral.
5/6
Zooming out to the 3M view, the broader structure remains constructive and still leaves room for another leg higher.
But after such a strong expansion, continued upside requires enough demand to keep absorbing supply at higher prices.
4/6
Key levels I’m watching:
🔴 Below 81K: a weekly close would weaken the short-term structure and strengthen the case for a deeper correction.
🟢 Above 84K: a clean break and sustained hold would strengthen continuation.
3/6
The developing October candle currently resembles a red spinning top.
That points to indecision after a strong Q3, but the monthly candle is still open. With nearly two weeks left, the structure can still change materially.
2/6
🟧 ON THE CHARTS
BTC closed the week around 82K after rejection near 84K.
Buyers stepped in quickly around 80K, leaving a pronounced lower wick. Selling pressure appeared, but demand around the lows remains active.
1/6 🧶

Interesting framing. If bulls can’t turn this breakout area into a stable range, then the move starts looking less like clean reaccumulation and more like a rally that still needs a deeper reset before continuation.
Another buy, and the pattern matters more than the headline size. Do you think Strategy’s continued accumulation still influences market sentiment, or has it become largely expected?
Good structure. Closing above the May highs gives BTC a clear higher-time-frame level to defend. As long as that holds, the trend remains constructive. A deeper pullback would make the rising bull-market support band the next important test.
Interesting historical pattern. The death cross is lagging by design, so its value here is less as a bottom signal and more as confirmation that a major reset has already happened. The stronger evidence is what price does after it.
Maybe BTC has more upside left than I currently expect.
My bias still leans toward a pullback, but right now the market has not confirmed it.
I would rather let the structure develop than force the chart to agree with my bias.
Read the full Monday Market Read on Telegram:
t.me/ChartelCrypto/68
6/6

CMC Fear & Greed is currently at 57, back in Neutral territory.
At the same time, the monthly Heikin Ashi structure still shows positive trend persistence.
That is why I would not force a bearish conclusion while the broader structure remains constructive.
5/6
My bias still leans toward a pullback.
On the monthly chart, I’m also watching the shape and rhythm of the price waves, not only individual candles and indicators. To me, the pace of expansion looks like it may be cooling.
The evidence has not confirmed that view yet.
4/6
Key levels I’m watching:
🔴 Below 83K: a weekly close would weaken the short-term structure and strengthen the corrective case.
🟢 Above 89K: a clean break and sustained hold would provide stronger evidence of continuation.
3/6
That lower wick matters.
The weekly candle is bearish, but demand at lower prices tempered the signal. Zooming out, the higher-time-frame structure still favors the bulls, while short-term evidence has become more balanced.
2/6
🟧 ON THE CHARTS
BTC closed the week around 84K after another rejection near 87K.
The candle formed a bearish engulfing body, but the long lower wick shows buyers stepped in around the lows and absorbed part of the selling pressure.
1/6 🧶

Neither the potential double top nor the RSI divergence confirms a reversal on its own.
The double top would still need confirmation through a break of support.
My bias still leans toward some cooling or consolidation, but the higher-time-frame structure remains constructive for now.
Read the full Monday Market Read on Telegram:
t.me/ChartelCrypto/67
6/6

On the daily chart, BTC may be developing a potential double top around 87K.
At the same time, price has made a higher high while RSI has made a lower high, creating a bearish RSI divergence.
Both point toward possible momentum cooling.
5/6