

Since 1993 ConceptDraw apps have been used worldwide for creating flowcharts, mindmaps, diagrams and projects https://xitter.cf/t.co/7ia4CfYrMA 📊📈📉⏳
Odessa, Ukraine / San Jose, CA
Joined September 2010
- Tweets3K
- Following944
- Followers951
- Likes1.7K




New Internet of Things Content is Available in ConceptDraw Solutions: conceptdraw.com/news/interne… via @CSOdessa
Update ConceptDraw MINDMAP 14 and PROJECT 13 to the Latest Versions: conceptdraw.com/news/mindmap… via @CSOdessa
ConceptDraw OFFICE v9 for macOS and Windows released: conceptdraw.com/news/office_… via @CSOdessa
Power Circuits solution for ConceptDraw DIAGRAM: conceptdraw.com/news/power-c… via @CSOdessa
One-Line Diagrams solution for ConceptDraw DIAGRAM: conceptdraw.com/news/one-lin… via @CSOdessa
Valuable Addition to Engineering Area in ConceptDraw Solutions: conceptdraw.com/news/basic-c… via @CSOdessa
CS Odessa Brings Business Diagramming to the Next Level with ConceptDraw OFFICE v8 CS Odessa Brings Business Diagramming to the Next Level with ConceptDraw OFFICE v8 conceptdraw.com/news/office_… via @CSOdessa
New Energy Industry Infographics Plugin Added to ConceptDraw Solutions: conceptdraw.com/news/energy-… via @CSOdessa

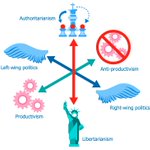
Example 10: Three-Dimensional Axis of Politics
The visual organization in #political groups, organizations, and parties in accordance with certain conceptual axes is accepted in the political sphere.

Example 9: Separation of Powers
This political infographic is dedicated to the separation of powers between authorities in France. The governance power is divided into three main branches — executive, legislative, and judicial. #ConceptDraw #PoliticsInfographics


Example 7: Politics of Japan
This sample illustrates the structure of the #political system in #Japan, which constitutes the multi-party bicameral parliamentary representative #democratic constitutional monarchy.

Example 6: Nolan Chart
This sample presents the Nolan Chart in its traditional form. It is a chart designed by American libertarian activist David Nolan in 1969 that expands political view analysis and allows you to take a broad look at libertarianism.

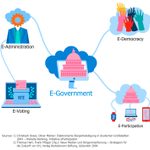
Example 5: E-Government Dimensions
This sample illustrates the dimensions of E-government that uses communication technologies and Internet to provide public services and information to the citizens of a certain country or region.

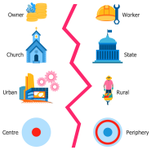
Example 4: Cleavages in Society
The listed conflicts appeared as the result of modernization processes and revolutions that have taken place in the countries of Western Europe. #ConceptDraw

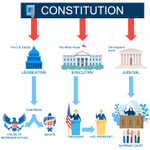
Example 3: Branches of US Government
This sample depicts the branches of the federal government of the United States according to the U.S. Constitution. #government
#ConceptDraw
#DIAGRAM
#Politics
#Infographics

Example 2: Anacyclosis
The diagram counts six components and is constructed in a form of a Circular Arrow diagram.
#government #monarchy #aristocracy
#democracy #ConceptDraw #PoliticsInfographicsSolution

Example 1: Two Party Preferred Counting Flowchart
This sample depicts a preferred voting form in Australia.
#ConceptDraw
#politics
#diagram

Business Process Framework eTOM created in ConceptDraw DIAGRAM using the combination of libraries from #EconomyInfographics Solution. An experienced user spent 10 minutes creating this sample.
ow.ly/QodZ50AqCiW
