

Most investors look too late. I track where capital moves first. Systematic rankings across 1300+ mining & resource stocks.
Joined April 2022
- Tweets7.6K
- Following169
- Followers9.7K
- Likes41.5K
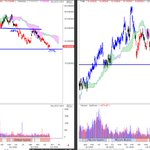




$PAAS – Unusual Relative Weakness. Something Brewing? 👀
Pan American Silver is down around 2% today while $SIL, $SILJ and several major silver producers are holding up significantly better.
This divergence is worth watching.
Could the market be anticipating a corporate transaction, possibly an acquisition by Pan American Silver?
There's no confirmed information suggesting that. But unexplained relative weakness sometimes precedes corporate developments.
Just a hypothesis, not a conclusion.
#Silver #PAAS #MiningStocks
A stock falling 40% doesn't automatically make it cheap. ⛏️
In a mining bull market, some of the biggest opportunities emerge after brutal corrections.
But here's the catch:
A 40% decline in a strong company may be an opportunity.
A 40% decline in a weak company may be just the beginning.
Look at $HYMC and $FSM.
Both suffered corrections exceeding 40%.
$HYMC broke major support and continued falling, eventually reaching a 71% drawdown.
$FSM found buyers near major support around $8 and subsequently rallied more than 50% from that area.
The difference isn't the size of the correction.
It's whether the long-term bullish structure remains intact, whether support holds, and whether selling pressure begins to fade.
I don't buy stocks because they've fallen enough.
I buy when the risk/reward becomes attractive.
Those are two very different things.
#GoldMiners #SilverMiners #TechnicalAnalysis

The best opportunities in a mining bull market rarely feel comfortable. ⛏️
When a stock is breaking out, everyone wants to buy.
When it pulls back toward major support, suddenly nobody wants it.
Yet that's often where I start paying attention.
My favorite setups?
Strong long-term uptrends.
Deep corrections toward major support.
Selling momentum beginning to fade.
I prefer buying uncertainty at support rather than paying a premium for confirmation.
But there's one rule: never confuse a broken bullish thesis with a buying opportunity.
#GoldMiners #SilverMiners #TechnicalAnalysis
In mining stocks, timing can be just as important as picking the right company. ⛏️
Buy too early, and you may endure a brutal drawdown.
Wait for confirmation, and you may miss a substantial part of the rally.
Sell too soon, and you miss the multibagger.
Hold too long, and you give back years of gains.
The real challenge isn't just finding the next great mining company.
It's knowing when the market is offering an opportunity — and when it's time to protect your profits.
#GoldMiners #SilverMiners #Investing
WOULD YOU BUY THIS GOLD MINING STOCK? 📊
Let's play a little game.
I'm showing you four charts of an undisclosed junior gold mining company:
- Absolute price performance
- Relative strength vs. Silver
- Relative strength vs. Gold
- Relative strength vs. GDX
The stock has been consolidating within a longer-term rising structure, while its relative performance against precious metals and the gold mining sector is approaching potentially important technical levels.
Here's the challenge:
Based exclusively on these charts, would you BUY, HOLD, or AVOID this stock at current prices?
Forget fundamentals, management, and the company name. Just focus on price structure, momentum, and relative strength.
I'm particularly interested in your interpretation of the three relative strength charts.
Would you take a position here, or wait for confirmation?
I'll reveal the company after hearing your views. 👀
#GoldMining #JuniorMiners #GoldStocks #TechnicalAnalysis #MiningStocks


🔎 TIME FOR THE REVEAL!
The mystery gold mining stock featured in my recent charts was...
🥁 ZODIAC GOLD ($ZAU.V ) ⛏️
Thanks to everyone who followed the charts and tried to identify the company!
Now that the mystery is solved, let's see how the technical setup develops. 📈
#GoldMining #JuniorMiners #ZAU
🌱AGRIBUSINESS | Weekly Market Analysis
Agribusiness stocks staged a modest rebound this week, with more companies advancing than declining.
But beneath the surface, the picture is considerably weaker.
Just four weeks ago, nearly 56% of the securities in our universe were trading above their 200-day moving averages. Today, that figure has fallen to just 30%.
Selling pressure has begun to ease, and some companies are showing resilience. Yet the recovery remains uneven, with substantial drawdowns and limited participation across the broader market.
This is an important distinction: a positive week is not necessarily the beginning of a sustained recovery.
The next few weeks will reveal whether improving momentum can spread across the sector or whether the recent rebound is merely a temporary pause in a weakening market.
Our latest study examines market breadth, drawdowns, volume dynamics, and the divergence between short-term performance and broader market structure.
Full analysis and interactive ranking of all 70 securities, freely available:
structuralalpharesearch.net/…

🔴 COPPER | The correction is no longer limited to a handful of stocks.
We've expanded our COPPER universe by 22 additional securities to better reflect the holdings of the COPX and COPJ ETFs. We now track 103 instruments.
And the results are concerning.
📉 91 out of 103 securities declined this week.
The median weekly return was −6.73%, but the real deterioration lies beneath the surface:
• Only 38.2% are trading above their 200-day moving average.
• More than half are down over 30% from their 52-week highs.
• Trading volume is picking up, but the balance between advancing and declining sessions continues to deteriorate.
This is not simply a price correction. It is a broad-based loss of market participation and strength.
That doesn't necessarily mean the copper bull market is over. But a sustainable recovery will require more than a rebound in a handful of stocks.
📊 Full analysis, including all 103 securities and interactive rankings:
🔗 structuralalpharesearch.net/…
#Copper #Mining #COPX #COPJ

GOLD & SILVER MINERS: THE LEADERSHIP DIVERGENCE
Gold and silver miners have been losing ground against their underlying metals. But how widespread is that weakness?
We have reconstructed 151 weeks of historical data across our GDX–GDXJ and SIL–SILJ universes to measure the percentage of mining stocks outperforming GLD and SLV.
The latest readings reveal a striking contrast.
GOLD MINERS vs. GLD
• Last week: only 22.4% outperformed gold.
• Last 4 weeks: just 19.7%.
• Last 3 months: 75.5%.
SILVER MINERS vs. SLV
• Last week: 52.1% outperformed silver.
• Last 4 weeks: 47.9%.
• Last 3 months: 58.3%.
The message is clear: gold miners have experienced a sharp deterioration in relative leadership over the past month, despite retaining a substantial advantage over the three-month horizon.
Silver miners show a different picture. Their relative performance is much more balanced, with neither side establishing decisive short-term leadership.
This distinction matters.
A sector can look weak over a few weeks while still retaining a stronger medium-term structure. Conversely, rising metal prices do not automatically translate into broad participation by mining equities.
The question is no longer simply whether gold and silver are rising. It is whether mining stocks are beginning to outperform their metals again.
That is what we will be monitoring in the weeks ahead.
But how unusual is this divergence historically? We examined 151 weeks of data to put the latest readings into perspective, revealing just how extreme the recent weakness in gold miners has become—and what to watch for signs of renewed leadership.
Full analysis, historical comparisons, and key conclusions at Structural Alpha Research:
structuralalpharesearch.net/…
Structural Alpha Research — October 16, 2026
#Gold #Silver #GoldMiners #SilverMiners #GDX #GDXJ #SIL #SILJ

WHAT IF WE'RE WITNESSING ONE OF THE MOST IMPORTANT BOTTOMS IN THE MINING SECTOR?
The weekly chart of the XAU Gold & Silver Index is showing a technical signal that deserves our full attention.
The last two weekly candles have formed hammer-like patterns, right where two critical technical factors converge: a long-term rising trendline and a key support area within the current correction.
This is no minor coincidence.
After weeks of weakness, buyers appear to be defending a price zone that could prove decisive for the next major move.
Has the bottom been confirmed? Not yet. Are there compelling technical reasons to believe one may be forming? Absolutely.
But the really interesting part emerges when we zoom out.
The 261.8% and 423.6% Fibonacci extensions point to extraordinary long-term upside potential. These are not guaranteed price targets, but technical projections illustrating what a powerful, sustained bull market could ultimately deliver.
Perhaps we're spending too much time worrying about the current correction and not nearly enough time thinking about what could come next.
The market still needs to confirm the reversal.
But if this confluence of support holds, we may be looking at one of the most significant long-term technical opportunities in the mining sector.
#XAU #GoldMiners #BullMarket
#Gold #Silver #GoldMiners #XAU #SilverMiners #BullMarket

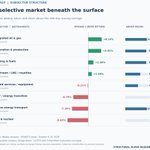
ENERGY | Weekly Market Analysis
Energy remains structurally resilient, with 65% of the universe trading above its 200-day moving average.
But the sector is far from moving in unison.
Oil & gas producers are leading the weekly advance, refiners retain strong global rankings, while oilfield services and renewable-energy stocks show considerable weakness.
The trend remains constructive. Participation is becoming more selective.
Full study and ranking of 169 instruments:
structuralalpharesearch.net/…

ENERGY SECTOR: ONE FINAL RALLY BEFORE A MAJOR CORRECTION?
The long-term Elliott Wave structure of the Energy Select Sector SPDR ETF ($XLE) suggests that the sector may be approaching the final stage of a major bullish impulse that began in 2020.
The recent breakout above long-term resistance, renewed momentum acceleration, and bullish Ichimoku configuration suggest that the advance may not be over yet.
My preferred scenario is one final, potentially powerful fifth-wave rally before a prolonged and significant correction unfolds.
This could coincide with crude oil breaking above the major $120 resistance area. Such a breakout might provide the catalyst for the final acceleration in energy stocks.
However, a subsequent pullback in crude oil could mark the beginning of a larger corrective Wave 2 in the energy sector.
The key distinction is between time horizons: bullish in the near term, but increasingly cautious about the medium-term outlook.
The fifth wave is not yet confirmed, and the timing of any major reversal remains uncertain. But the long-term structure suggests that the next significant rally could also be the final one of this cycle.
#Energy #CrudeOil #XLE #ElliottWave #TechnicalAnalysis

Mining Breadth: What Happens When the Market Starts to Recover?
When fewer than 25% of mining stocks trade above their 200-day moving averages, the sector is experiencing extreme weakness.
But does that necessarily represent a buying opportunity?
We examined more than three decades of XAU data, focusing on periods when market breadth began recovering from extremely depressed levels while the index itself remained below its 200-day moving average.
The findings are interesting, but not as straightforward as they might seem.
Across 36 historical episodes with complete follow-up data, the XAU recovered its 200-day moving average within the following 120 trading sessions in approximately 81% of cases.
Among the episodes that achieved that recovery, the index gained a median 10.3% before reaching its 200-day moving average.
In other words, a substantial portion of the rebound often occurred while the market still appeared technically weak.
However, a critical limitation emerged.
When we compared these signals with other periods of similar market weakness, controlling for the XAU's distance from its 200-day moving average and matching by decade, the apparent advantage became much less convincing.
Does Improving Mining Breadth Provide an Edge?
Median XAU returns over the next 120 trading sessions | 1990–2026
Market ConditionMedian ReturnBreadth recovery signal+6.91%Matched market conditions+1.35%
The comparison included 35 matched historical observations, grouped by decade and distance below the XAU's 200-day moving average.
Despite the difference in median returns, the breadth signal outperformed its matched comparison in only 19 out of 35 cases (54%).
Results also varied considerably across decades.
This suggests that improving breadth can precede powerful recoveries, but it does not provide a consistently reliable buy signal on its own.
The Bottom Line
Market breadth can reveal something price alone may not immediately show: the sector can begin recovering internally before the index confirms a trend reversal.
But identifying that transition is not the same as knowing how it will unfold.
Extreme breadth identifies market conditions. Improving breadth signals a potential transition. Neither guarantees that the bottom is in.
Methodology: Historical daily XAU and percentage-above-MA200 breadth data, 1990–October 16, 2026. The exploratory signal required a 10-percentage-point breadth recovery from a 60-session low below 25%, while breadth remained below 30% and the XAU remained below its MA200. Signals were spaced at least 60 trading sessions apart. Returns use daily closes, exclude trading costs, and have not been independently validated out of sample. The historical composition of the breadth universe has not been fully verified.
This article is independent research, not investment advice.
#MiningStocks #MarketBreadth #GoldMiners #XAU #TechnicalAnalysis #QuantitativeResearch

🔴 URANIUM | A sector under severe pressure
The correction in uranium and nuclear stocks is becoming increasingly widespread.
Market breadth has deteriorated dramatically. Most securities are trading well below their long-term trend, drawdowns are deepening, and selling pressure continues to dominate.
Even the sector's leading ETFs have been unable to escape the weakness.
There is an interesting question here.
Are we approaching the kind of extreme conditions that precede a major recovery, or is this correction still unfinished?
Deeply depressed markets can eventually offer exceptional opportunities. But weakness alone does not confirm a bottom.
For now, the missing ingredient is a sustained improvement in market participation.
Our latest study examines the underlying structure of the uranium sector, including breadth, drawdowns, volume and the complete ranking of 75 securities.
📊 Full analysis:
structuralalpharesearch.net/…
#Uranium #NuclearEnergy #Mining

I believe the uranium sector still has further downside ahead, and some individual stocks could fall considerably from current levels.
Even the URA/NDX ratio could break below its long-term support levels, although that is far from certain. A further decline in URA may coincide with a broader Nasdaq selloff, potentially limiting the deterioration in the relative ratio.
Either way, I don't think the correction is over yet.
🥈 SILVER MINERS | SIL–SILJ
The correction in silver miners continues to deepen.
Selling pressure has spread across virtually the entire sector. Fewer companies are managing to hold their long-term trends, while drawdowns from previous highs continue to grow.
But there's something interesting beneath the surface.
Despite the deterioration of recent weeks, many miners still retain considerable relative strength when viewed over a longer time horizon.
In other words, the market is punishing companies with very different underlying performance almost indiscriminately.
Trading volumes have yet to show signs of widespread capitulation. Selling pressure persists, but convincing evidence of stabilization is still missing.
This correction may be creating opportunities, but we have no confirmation yet that it has run its course.
Our latest study examines market breadth, volume, drawdown depth, and the companies showing the greatest resilience.
📊 Complete ranking of 98 securities, with searchable weekly rankings.
🔗 structuralalpharesearch.net/…
#Silver #SilverMiners #MiningStocks #SILJ #MarketBreadth

JUNIOR MINERS | What’s really happening beneath the surface?
Gold mining ETFs have corrected. But the damage beneath the surface tells a much more revealing story.
Our latest study examines 482 junior mining stocks, and the numbers are striking.
📉 71.4% are trading more than 30% below their 52-week highs.
Even more remarkable, nearly 4 in 10 have fallen more than 50%.
Only 24.4% remain above their 200-day moving average, following a sharp deterioration in market breadth.
The median junior miner lost another 5.15% this week, while the 20-session directional volume balance deteriorated further.
Yet here's the interesting part.
Despite this widespread weakness, a handful of companies continue to show remarkable relative strength.
Two very different markets are emerging within the same sector.
Is this the kind of internal damage that eventually creates exceptional opportunities? Or does the correction still have further to run?
The answer may lie in how breadth, drawdowns and volume evolve from here.
We've published the complete analysis, including an interactive, searchable ranking of all 482 companies.
Go beyond the ETFs. See what's happening underneath.
🔗 structuralalpharesearch.net/…
#GoldMiners #JuniorMiners #Gold #MiningStocks

What if gold and silver miners are approaching a major turning point?
This long-term SILVER/XAU ratio tells a fascinating story.
My interpretation is that the ratio may have completed a five-wave corrective structure, with a failed fifth wave at the recent low.
If that count is correct, the implications could be enormous.
Think about it: if silver enters another powerful leg higher while mining stocks begin to outperform the metal, the upside potential for silver miners could be extraordinary.
A rising silver price is one thing. A rising silver price combined with a major reversal in miners' relative strength is something else entirely.
The structure still needs confirmation, but this is precisely the kind of long-term setup I look for before a potentially explosive sector move.
The chart is telling us something worth watching very closely.
#Silver #SilverMiners #GoldMiners #XAU #PreciousMetals #MiningStocks

GLOBAL MARKET STRUCTURE | October 16, 2026
The divergence across global markets is becoming impossible to ignore.
While the S&P 500 and STOXX 600 posted median weekly gains of +2.68%, most mining sectors suffered another sharp decline.
And the real story goes far beyond prices.
Market breadth tells a very different story:
• ENERGY: 65.1% of stocks above their 200-day moving average
• GDX–GDXJ: 29.5%
• SIL–SILJ: 26.8%
• JUNIOR MINERS: 24.4%
• URANIUM: 11.1%
• LITHIUM: just 3.7%
The deterioration has been particularly dramatic in precious metals miners.
Over the past four weeks, MA200 breadth has fallen by 34.5 percentage points in GDX–GDXJ and 27.1 points in SIL–SILJ.
Meanwhile, 71% of junior miners, 85% of uranium stocks, and virtually the entire lithium universe are trading more than 30% below their 52-week highs.
Directional volume remains negative across all ten non-broad-equity universes.
This is not a synchronized market correction. It is a profound divergence in market participation.
The next move in mining indices will matter. But what matters even more is how many stocks participate — and whether volume confirms it.
Our latest GLOBAL study examines all 12 universes, with comparative charts, breadth, drawdowns, volume, and the full cross-market breakdown.
Free, independent research:
structuralalpharesearch.net/…
#Gold #Silver #MiningStocks #Commodities #MarketBreadth #StockMarket
