









One of the greatest mangas to capture the highs and lows of trading just got its anime adaptation. Treat yourself, it fucking rules.

Econ Brah retweeted

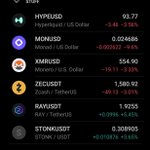
$RAY is a beast. And the crazy thing is that funding is neutral and open interest isn't even that high to begin with (IE: no froth).
It seems to be benefiting a lot from the StonkFun launchpad + RWA narrative.


Educational posting.
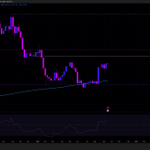
This flat bottom around the 200 week MA is a classic BTC bottom. Look at them historically, and it's always this. Puke down, flat for a month +, and then a massive candle up. Past results =/= future performance, but until proven wrong, that's a mf bottom.


Unfortunately the replies are people telling him how stupid he'll look when this is a lower high so I'm now maxx bullish.


My GOAT has been in a war of attrition with some of the worst people on the internet and still has time to drop bangers like this, very strong follow.

We could save a lot of new traders a lot of time by having a 5 minute video called "Its over fitting and it doesn't predict shit." Just tape "bias-variance trade off" over your monitor.

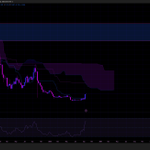
Great follow if you want to understand curve fitting, because his charts are a live demo of it.
Curve fitting = building a model that matches past data really well, by tuning it until it lines up. But a model that explains the past perfectly and a model that predicts the future are not the same thing.
Every model has knobs. On a chart, the knobs are things like: which lows you connect for a trendline, the length of a moving average, log vs linear scale, the period on an oscillator, where you anchor Fibonacci levels, the start/end dates you choose to show, etc.
The more knobs you add, the more closely you can match any history, including the random noise in it. With enough knobs, you can draw a model that fits any past chart almost perfectly. It appears like insight but in reality, it's just having enough free knobs. So a tight fit on past data tells you almost nothing on its own. The question is always: how many knobs did you turn to get there? A model that needs 8 hand-picked knobs to fit the past is far weaker than one that needs 1.
Fitting the past and predicting the future are pulling against each other, and past a certain point every additional knob you spend on a tighter historical fit is bought at the cost of predictive power. When the past stops matching, you add another knob. "It's an extended cycle now." "It's liquidity-weighted." Each adjustment re-fits the model to what already happened. In hindsight (and *only* in hindsight), it always looks right.
1) Develop model
2) Add/change knobs to fit
3) “Subscribe to my paid newsletter”
4) Watch model crash and burn
5) Back to 2)