

Financial markets research| Cycles | Elliott Waves | TA |Join my Slice Room @BraVoCycles for real-time action: https://xitter.cf/t.co/z8Iemsr92x
Virginia, USA
Joined February 2024
- Tweets9.6K
- Following281
- Followers20.6K
- Likes4.7K




BraVoCycles Newsletter retweeted
$SPX vs McClellan Summation Index (MCC SI)
MCC SI, the trend indicator, curled up, but it did not help SPX.
A red flag? I suspect that the MCC SI will again curl down.

BraVoCycles Newsletter retweeted
Cycles tell you when. FLD targets tell you where. Elliott Waves tell you what the move is.
I run all three live: SPX, NDX, ... signals and options setups, and much more, plus live chat where you can ask me directly. All in real time.
That’s the @BraVoCycles Live Room on Slice. @SliceApp


Market Twists & Turns Pro - Promotion is Back
Right now, you can lock in full access for the first 3 months at $5.85/month — an 85% discount.
Get high-conviction cycle timing, precise price projections, and Elliott Wave analysis on stocks, crypto, commodities, and forex.
Serious traders and investors love it. Subscribe here 👇
bravocycles-newsletter-marke…

BraVoCycles Newsletter retweeted
Spinning Top Candlestick
• Many mistakenly think that Spinning Top is a bearish pattern, perhaps because of the word “top” in it.
• In isolation, it is essentially a neutral/hesitation/indecision pattern; Per Bulkowski, spinning tops reverse the prior trend only about 50% of the time (a coin flip).
• A spinning top candlestick is a short body candle with long upper and lower wicks, signaling market indecision and potential trend reversal or continuation depending on context
• While Investopedia does not have a dedicated “spinning top” entry, its candlestick charting guide explains that each candlestick is defined by open, high, low, and close prices. A spinning top is a specific variation where the real body is very small (open and close are nearly equal) and is flanked by long wicks on both sides. This shape shows that during the period, price moved significantly in both directions but ended near the starting level.
• How it forms
• Small body: Open and close prices are almost the same. Long wicks: Price tested both higher and lower levels before settling near the start.
• Neutral sentiment: Neither buyers nor sellers gained control.
• Market meaning
• Indecision: The pattern reflects a balance between bulls and bears, with traders unable to sustain a clear upward or downward move.
• Potential reversal:
• At the top of an uptrend, it may signal bullish momentum is fading.
• At the bottom of a downtrend, it may indicate bearish momentum is.
• Possible continuation: In some cases, it acts as a pause in the trend, with the next candle confirming the direction.
• Trading implications
• Confirmation needed: Traders often wait for the next candle’s direction before acting, to avoid false signals.
• Context matters: The spinning top’s significance depends on the surrounding trend and other technical indicators.
• Not a standalone signal: It is best used alongside other tools for confirmation.
• In short: A spinning top candlestick is a neutral, indecision pattern with a small body and long wicks, often used to flag possible trend changes when it appears at the extremes of a move, but it should be confirmed before trading. It is best to use it together with other technical indicators.

BraVoCycles Newsletter retweeted
At the Oct 5 spinning top near NDX highs (~31k), Commercials (smart money) were extremely short (–68.4k net) while Large Speculators were extremely long (+58k). Both the 6-month and 36-month COT Indexes sat at 0%.
NDX then corrected sharply. Classic COT divergence at the top — smart money hedging into strength, specs crowded long.
#COT $NDX $QQQ $NQ

BraVoCycles Newsletter retweeted
Gold Miners Swing Cycles
The 2 out of 3 $GDX sing cycles will produce troughs in Nov'26 and Mar'27.
These could be trade opportunities. The key word is "trade."

BraVoCycles Newsletter retweeted
What dragged down Technology stocks?
First Chinese memory and AI chip competition, then AI debt fears.
CoreWeave's $51B debt load is rattling AI stocks.
Default insurance costs jumped 33% in a week, signaling credit stress.
The CEO cites a $100B backlog. But promised cash flows still need to arrive.
$NDX $QQQ #SOX $SMH
Cycles tell you when. FLD targets tell you where. Elliott Waves tell you what the move is.
I run all three live: SPX, NDX, ... signals and options setups, and much more, plus live chat where you can ask me directly. All in real time.
That’s the @BraVoCycles Live Room on Slice. @SliceApp
Market Twists & Turns Pro - Promotion is Back
Right now, you can lock in full access for the first 3 months at $5.85/month — an 85% discount.
Get high-conviction cycle timing, precise price projections, and Elliott Wave analysis on stocks, crypto, commodities, and forex.
Serious traders and investors love it. Subscribe here 👇
bravocycles-newsletter-marke…
$SPX vs McClellan Summation Index (MCC SI)
MCC SI, the trend indicator, curled up, but it did not help SPX.
A red flag? I suspect that the MCC SI will again curl down.
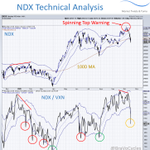
The Nasdaq just posted its worst week since June on AI debt worries and Chinese chip competition.
NDX also slipped below its 100-day MA. Is it a bear trap?
Free: NDX technical analysis 👇
Pro: + semis, US dollar, value play
bravocycles-newsletter-marke…
