Swing & Position Trader Breakout | Liquid Leaders | Episodic Pivot All posts = education only. Not financial advice. Trade at your own risk.
Joined June 2020
- Tweets10.6K
- Following182
- Followers9.7K
- Likes49.8K



Pinned Tweet
$RKLB $TSLA $ASTS $MU $FSLR $SNDK $NVDA
For 2026 here is full fledged trading system as taught by @Qullamaggie
Now it's upto us to put in that enormous hard work, be disciplined, execute with concentration and FOCUS
Wish you all happy holidays!!


2026 is the year of FOCUS, Concentration and Deep , Disciplined work.
@Qullamaggie , FOCUS is difference between you living in yatch vs street
$TSLA $RKLB $ASTS $COST $NVDA
@lonextrades

$SNDK $MU $AMD
I was listening to this song and can totally relate to it
Lonely, I'm Mr. Lonely
I have nobody for my own
I am so lonely, I'm Mr. Lonely
🎵 Mr. Lonely
Every trader's theme song.
Nobody sees the prep before the bell.
Nobody feels the loss but you.
Nobody claps when you sit on your hands.
The best entries feel lonely.
If everyone agrees with you, you're late.
The vertical starts when you're alone.
The blowoff is when the whole crowd shows up.
No boss to blame. No team to hide behind.
Your stop is the only friend who never lies.
Lonely isn't a weakness.
It's the edge.
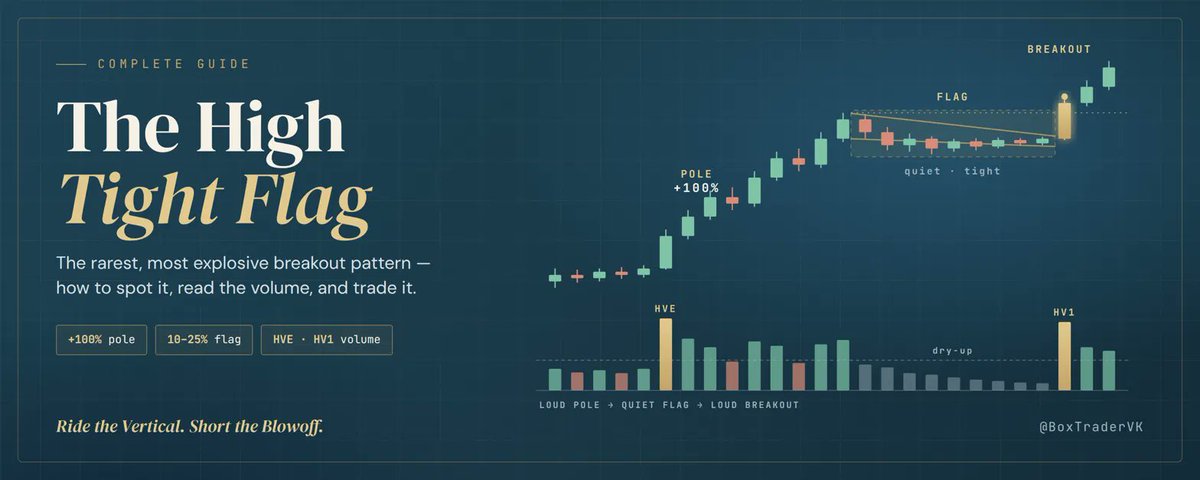
Ride the Vertical. Short the Blowoff.
Not advice.
$SOXL
LASER FOCUSED
What a real market bottom looks like (46 bottoms, 20 years):
✅ Low comes after the first hour
✅ 1-hour candle closes off its low
✅ Day closes in the top half of its range
✅ Next 1-2 days close above the bottom day's high
❌ Back under the low = failed
Not advice.
$QQQ $SPY $IWM $MU $SOXL $RAM
1/ I studied every stock market bottom of the last 20 years.
46 bottoms. SPY, QQQ, IWM. Down to the minute.
Most of what traders believe about bottoms didn't hold up. 🧵
2/ Myth 1: "Buy the opening flush."
Only 7 of 33 bottoms made their low in the first hour.
Take out 2008 and it's 3 of 23.
1 in 3 made the low after 2pm.
3/ At the real bottoms (the lows that held), the first hour was RED 8 out of 9 times.
Sellers kept selling all morning. The low came later.
4/ Myth 2: "Bottoms come on massive panic volume."
The 2 biggest panic-volume opens of the last 20 years, Aug 2015 and Feb 2020, were NOT the bottom. Both lows broke later.
At every real bottom I had minute data for, opening volume was never even double normal.
5/ Only 2 of the 13 real bottom days had double volume.
5 of the 13 opened HIGHER than the day before.
7 of the 13 closed GREEN.
Many real bottoms looked like nothing special.
6/ Fake bottoms were LOUD.
Candles about twice as big. Heavier volume. Selling right into the close.
Real bottoms got quiet. The last hour was barely above normal volume.
7/ The candle that made the low:
Most closed off their low, often a hammer or long tail.
Price took out its high, often within 15 minutes.
3 of 4 bottom days closed in the top half of the day.
8/ Myth 3: "Buy the hammer."
That flush-and-bounce candle showed up 102 times from 2007 to 2020.
It caught the real low only 9 times.
9 out of 10 times, its low got taken out within a month.
9/ A gap down on heavy volume during a correction?
33 times from 2007 to 2020.
Only 8 were the actual bottom day.
10/ What helped most: waiting for the next day to close above the bottom day's high.
That cut the fakes in half. Even then, about half still failed.
April 2025: the day after the low opened up big and closed red. The day after that: +10%.
11/ What to look for:
1-hour: low after the first hour, candle closes off its low, volume up but not crazy
Daily: close in the top half, hammer or long tail
Day after: close above the bottom day's high
Back under the low = it failed
12/ QQQ and IWM told the same story.
Bottoms are a process, not one candle. Calm beats panic.
Not advice, just what the data showed.
Ride the Vertical. Short the Blowoff.
Lot to learn from my bro @anandragn
Not about fancy returns
But how to keep things simple
Keep focus
Keep growing
Taking one trade at a time
Being sniper , not spreading oneself thin
Not carried away by being too bullish or market goes to 0
There is always a good trade around the corner
Just focus, shut down the damn noise and manage risk
Not look to double account on every trade or take too many trade thinking that will work either

Performance deserves to be shared when the going gets tough too, not just when everything is going up in a rip-roaring market.
(No options and only equities)
Finished September up 10.5%. Despite the ridiculous chop, I picked my spots well, although a few nasty gap downs once in a while took away what could've been an even better month.
October started super strong, then the back and forth began. Still around +2% MTD, but the equity curve hasn't been pretty these last couple of weeks.
Making money in a rip-roaring market is one thing. Keeping it when the market turns into a choppy mess is another.
Drawdown control is more than half the battle. I'd rather protect what I made in August and September than give it all back trying to force another September.
I wish more people would share how they've done over the last couple of months, especially during the rough stretches. There is a lot to learn from how others are handling this mess, not just their winning screenshots.
There is a time to press, then there is a time to protect
, and a time to sit out. Having the situational awareness to know when to do what makes a whole lot of difference.
Sharing for educational purposes only.


$QQQ $SPY $IWM $MU $SOXL $RAM
1/ I studied every stock market bottom of the last 20 years.
46 bottoms. SPY, QQQ, IWM. Down to the minute.
Most of what traders believe about bottoms didn't hold up. 🧵
2/ Myth 1: "Buy the opening flush."
Only 7 of 33 bottoms made their low in the first hour.
Take out 2008 and it's 3 of 23.
1 in 3 made the low after 2pm.
3/ At the real bottoms (the lows that held), the first hour was RED 8 out of 9 times.
Sellers kept selling all morning. The low came later.
4/ Myth 2: "Bottoms come on massive panic volume."
The 2 biggest panic-volume opens of the last 20 years, Aug 2015 and Feb 2020, were NOT the bottom. Both lows broke later.
At every real bottom I had minute data for, opening volume was never even double normal.
5/ Only 2 of the 13 real bottom days had double volume.
5 of the 13 opened HIGHER than the day before.
7 of the 13 closed GREEN.
Many real bottoms looked like nothing special.
6/ Fake bottoms were LOUD.
Candles about twice as big. Heavier volume. Selling right into the close.
Real bottoms got quiet. The last hour was barely above normal volume.
7/ The candle that made the low:
Most closed off their low, often a hammer or long tail.
Price took out its high, often within 15 minutes.
3 of 4 bottom days closed in the top half of the day.
8/ Myth 3: "Buy the hammer."
That flush-and-bounce candle showed up 102 times from 2007 to 2020.
It caught the real low only 9 times.
9 out of 10 times, its low got taken out within a month.
9/ A gap down on heavy volume during a correction?
33 times from 2007 to 2020.
Only 8 were the actual bottom day.
10/ What helped most: waiting for the next day to close above the bottom day's high.
That cut the fakes in half. Even then, about half still failed.
April 2025: the day after the low opened up big and closed red. The day after that: +10%.
11/ What to look for:
1-hour: low after the first hour, candle closes off its low, volume up but not crazy
Daily: close in the top half, hammer or long tail
Day after: close above the bottom day's high
Back under the low = it failed
12/ QQQ and IWM told the same story.
Bottoms are a process, not one candle. Calm beats panic.
Not advice, just what the data showed.
Ride the Vertical. Short the Blowoff.
$SNDK
Deep Weekend Thoughts
Thursday looked like the bottom.
Friday broke Thursday's low.
Semis down over 10% on the week. QQQ down over 5%. Friday closed near the lows. Brutal.
If you got hit, breathe. Selloffs end. The question is whether you're still standing when it does, with your money and your head intact.
That's job one.
Job two is the one most people skip:
Everyone's staring at what broke.
I'm studying what didn't.
In a week like this, most charts lose the 10 & 20 fast. A few don't:
→ Tight candles
→ Holding near highs
→ Barely moved while everything bled
That's usually big money refusing to let go.
And when the market turns, those names are often the first to move.
So no guessing the bottom. No buying the first bounce.
This weekend I'm building one list: every chart that refused to break.
The selloff is the noise.
The survivors are the signal.
Not advice. Just how I see it.
Ride the Vertical. Short the Blowoff.


$WDC
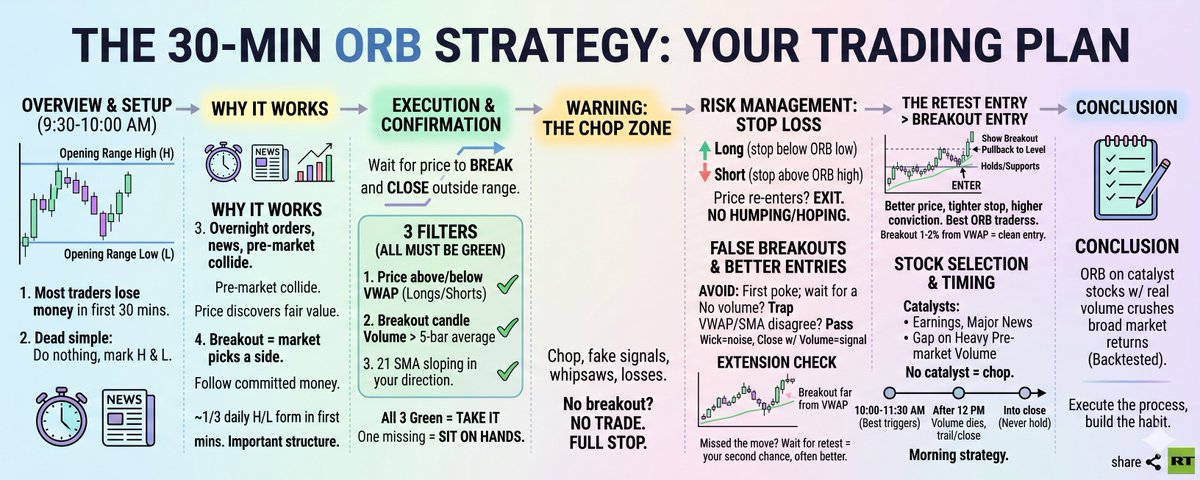
Absolutely game changer
combine
Parabolic Long set up
30 minute ORB so you dont get faked out
1hour chart, no 2/5/10 minute higher time frame = more conviction
Flag perfect perfect example , I never trade level per se always chart pattern.

$SNDK $NBIS $CRWV
I used to oversize every trade every damn trade
Now I have below print out as constant reminder
Oversize and the trade owns you.
In the trade:
• You hesitate at the entry, then chase
• Tight stop to fit the size = shaken out
• Every dip feels like a crash
• You move your stop and hope
• You sell winners early
In your account:
• A gap down blows right through your stop
• On margin, one bad day can force you out
• One bad trade sets you back months
• Lose half, you need to double just to get back
In your head:
• You trade the P&L, not the chart
• You can't sleep or leave the screen
• You revenge trade to win it back
Smaller size flips it:
• Fewer shares, wider stop, same risk
• Stop goes at a real level
• The trade gets room to breathe
• You sit through the shakeout
• You pull the trigger, no hesitation
• A loss is easy to take
Small size. Clear head. Long career.
Not advice.
Ride the Vertical. Short the Blowoff.
$QQQ
Failed breakout on heavy volume
likely weeks and/or months of chop until breakout again
however stock with strong catalyst heavy volume HVE etc/oversold bounces etc will be the focus
but oversold bounces on strong names 1-2 days types..
$QQQ
Key levels I am watching 722
if we loose 722 then 700 comes next
over sold bounce? or we continue to go down
looking for huge flush for any oversold bounce
however my preference always trend the range - I want to see tight days/range and then breakout or breakdown to play that..

$QQQ
Key levels I am watching 722
if we loose 722 then 700 comes next
over sold bounce? or we continue to go down
looking for huge flush for any oversold bounce
however my preference always trend the range - I want to see tight days/range and then breakout or breakdown to play that..


$NBIS
blind dip buying on strong stocks also as expensive as chasing stretched breakouts
Dip buys can get very expensive too just like chasing breakouts
Real edge is when to do what and which stock
And that comes from grind oneself into thin powder to understand and act on things inside and out..
FOCUS
$META
$MU
Simply buying support without really understanding chart pattern, market context and volume wont work out in long term
if need gigantic returns, need to understand all these 3..
wish it was so simple just to buy at support and sell at resistance..