

Promoting plant scientists, plant research, & plant admiration since 1893. Publisher of #AJB, #AppsPlantSci & #PlantSciBull. We no longer post on X as of 2025.
- Tweets11.1K
- Following3.5K
- Followers21.1K
- Likes3.2K





ALT A dark blue background with fireworks can be seen. The BSA logo and the logos for Bluesky, Instagram, Facebook, and BSA Slack are also on the image. Text: Happy New Year! Join us on Bluesky!

ALT An informational graphic with a green header titled "Botanical Society of America Awards." The graphic is divided into two sections: BSA Awards Now Open - Established Scientists: Lists three awards, including the Donald R. Kaplan Memorial Lecture (Deadline: January 10, 2025), Corresponding Members (Deadline: February 3, 2025), and AJB Synthesis Papers and Prize with $2000 (Deadline: February 17, 2025). BSA Awards Now Open - Students: Features awards like the $10,000 Graduate Student Dissertation Award in Phylogenetic Comparative Plant Biology (Deadline: February 3, 2025), the $10,000 Donald R. Kaplan Dissertation Award in Comparative Morphology (Deadline: February 3, 2025), the $1,500 BSA Graduate Student Research Awards (Deadline: February 17, 2025), and the $500 BSA Undergraduate Student Research Awards (Deadline: March 15, 2025). A URL is included at the bottom: www.botany.org/home/awards.html.

ALT A graphic with a red background titled "Open Committees." It invites participation in BSA committees, listing options such as the Committee on Committees, Development Committee, and Diversity, Equity, and Inclusion Committee (student openings noted with an asterisk). The deadline to apply is February 1, 2025. A floral illustration decorates the graphic, with a URL at the bottom: www.botany.org.

ALT growing plants can be seen in this image. Text: Make a difference with your donation! Donate to the BSA GSRA Fund. Invest in the future of Botanical Sciences.

ALT This image shows a blue background with white clouds. A white logo for Bluesky and the words, "Join us on Bluesky!" @botsocamerica.bsky.social. BSA can also be found on Instagram, Facebook, and BSA Slack. The BSA logo can also be seen.

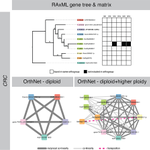
ALT Figure showing the genes that comprise an orthogroup, graphically represented by a gene tree (left) and a gene cluster grouped by species (middle and right). Image credit: Irene Liao

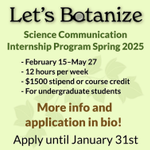
ALT A flyer about Let's Botanize. For more information, visit https://www.letsbotanize.org.

ALT A microCTscan showing a pine leaf in cross section at 0.56 micron resolution, high-detail anatomy with visible plastids.

ALT Chinedum Anajemba, a graduate student and member of BSA, sits on a rocky outcrop under a bright blue sky. Next to him is a quote describing the impact of the J.S. Karling Graduate Student Research Award, which supported his research on polyploidy in ferns and affirmed the importance of his work. The Botanical Society of America logos are in the bottom corner of the image.


ALT Map of sampling sites in Taiwan, tree with epiphytic fern Ophioderma pendulum, and sampling design and purpose.

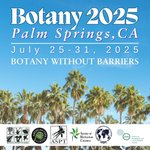
ALT Graphic promoting Botany 2025 in Palm Springs, CA, taking place July 25-31, 2025. The tagline reads "Botany Without Barriers" against a bright blue sky with tall palm trees. Logos of supporting societies are displayed along the bottom, including the Botanical Society of America, American Fern Society, ASPT, Society of Herbarium Curators, IAPT, and ABLS.


ALT Summary bipartite network diagram showing mistletoe-host interactions across all Australian showy mistletoe genera. The top half displays host orders, each colored by major seed plant clade: asterid orders in shades of red, rosid orders in blue, basal eudicots in yellow, magnoliids in green, and conifers in brown. Dilleniales is marked in orange and Santalales in lime green. Tick marks represent increments of 100 observations.


ALT Watercolor illustration portraying seven tropical tree species growing in French Guianan forests: Eperua falcata Aubl., Iryanthera hostmannii (Benth.) Warb., Jacaranda copaia subsp. copaia Aubl., Pterocarpus officinalis Jacq., Symphonia globulifera L.f., Tachigali melinonii (Harms) Zarucchi & Herend, and Virola surinamensis (Rol. ex Rottb.) Warb. These species thrive in seasonally flooded forests, a unique and understudied ecosystem. (Image credit: Antia Iglesias, artist and PhD.)

ALT This image shows Emma Fetterly and the following quote, "The GSRA had a huge impact on my research, allowing me to explore new questions and expand my project in exciting ways. With the award funds, I was able to do additional fieldwork and even bring an undergraduate student along to gain hands-on experience. I’m grateful to be part of a community that supports and values student research, thank you BSA!"

ALT Underside of yellow Ranunculus austro-oreganus corolla, with showy orange veins.

ALT This study used an optimized qPCR protocol to show high host-specificity in foliar endophyte colonization levels along a successional gradient.

ALT Representative images of an Oxalis debilis (A) and Chamaecrista fasciculata (B), with a black arrow pointing to the pulvini in each respective image. Images of a leaf in which a single embolism event that propagated through the pulvini is shown in color (C and D) with the corresponding water potential at which the embolism events occurred. All embolism events across the leaf were color-coded by the water potential at which they were observed (E and F). For each species, a color scale (G and H) depicting the water potential with each embolism event that occurred is shown below the corresponding image.