

Servers, Containers, and Applications monitoring made easy. #DevOps #Monitoring #Observability #Cloud
- Tweets446
- Following72
- Followers323
- Likes260





ALT Five members of the Bleemeo team standing shoulder to shoulder on a boat deck in matching blue Bleemeo t-shirts, smiling into low evening sun, the wooded coastline of Porquerolles and moored sailing boats behind them.

ALT Two Bleemeo team members at the bow of a sailing boat under way: one hauls on a line, the other points out towards a low green island on the horizon. The Bleemeo logo is visible across the back of his t-shirt.

ALT View from the wooded hillside above a Porquerolles bay: seven sailing boats and catamarans at anchor over pale turquoise shallows, a crescent of beach to the right, and the mainland hills across the water.

ALT Sunset seen from the deck of the team's boat at anchor: the sun low over the dark silhouette of the island, a long golden reflection running across the water, the stainless guardrail in the foreground and other yachts moored nearby.

ALT Three cards, one per pillar. Metrics (bar-chart icon): THAT it broke — "p95 latency crossed 300 ms". Logs (document icon): WHAT broke — "pq: deadlock detected". Traces (waterfall icon): WHERE the time went — "payment-api: 2.4 s of 2.6 s". Underneath, the question all three serve: why?


ALT A four-point September audit card. 1: read what fired in August — an alert that fired forty times and changed nothing is noise. 2: list what expires before December — certs, domains, tokens. 3: un-summer the on-call rota. 4: page yourself. Thirty minutes now, or a 3 a.m. page in October.

ALT incident.png Five-step incident timeline: Detect, Triage, Mitigate, Resolve, Learn. Mitigate is highlighted and tagged customers stop hurting here. Brackets above mark MTTA over the first two steps and MTTR over the first four. Headline: stop the bleeding first, understand it later.

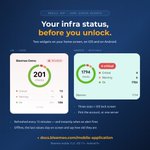
ALT Two screenshots of the Bleemeo account health widget: a large iOS widget showing 201 checks — 10 critical, 5 warning, 186 OK — and the same widget on Android showing 1794 checks. Beside them: three sizes plus iOS lock screen, refreshed every 15 min and instantly on an alert.

ALT Two cards compare label cardinality. Left, green: job 3, instance 12, status 5, user_id kept in logs — 180 time series. Right, red: the same plus user_id at 40,000 values — 7,200,000 time series, a ×40,000 badge between them. Below, the PromQL query that ranks your metrics by series count.

ALT Two screens side by side. Left, crossed out: a corridor TV with 24 tiny identical graphs, labelled "unreadable at five metres". Right, ticked: kiosk mode — a honeycomb status grid with one red tile, one big error-rate number, and a clock. Legible at five metres, or it's wallpaper.

ALT A Prometheus rule named HighErrorRate: 5xx rate over total requests above 5%, for 5m, with a summary line. Four callouts mark its parts — a signal users feel, a threshold tied to impact, a duration not a blip, a message you can act on. Alert on symptoms, not every cause.

ALT Three cards give the monthly downtime each uptime target allows: 99% is 7h 12m, 99.9% is 43m, 99.99% is 4m 19s. An error-budget bar for day 20 of 30 shows 30m spent in red and 13m left in green. Headline: 99.9% isn't a promise, it's a budget.

ALT Chart of disk usage rising gently over six hours to 67% used, then a red dashed line extrapolating the trend up to 100% in about 3h 42m. Below it, the query predict_linear(disk_used_perc[6h], 4*3600) >= 100. Headline: alert before the disk is full.

ALT Quiz card: it's 2 a.m. and your phone buzzes — what's your first move? Grab the laptop (The Firefighter), check if it self-healed (The Zen Master), study the dashboard (The Dashboard Artist), open the runbook (The Guardian). Six questions, four types, in the free Workbook.

ALT Four dashboard tiles, one per Golden Signal: Latency 214 ms p95, Traffic 1.2k requests per second, Errors 2.3% 5xx rate, Saturation 78% of CPU and memory. Latency and Errors are what users feel, Traffic and Saturation what the box is doing. If you build only four graphs, build these.

ALT Mock status panel headed ALL SYSTEMS OPERATIONAL, with green ticks for servers up 247 days, backups tested for real, the 3 a.m. page answered and the incident you missed already fixed — reason: a human you probably forgot to thank. Headline: Happy SysAdmin Appreciation Day.

ALT Latency distribution chart: a tall peak near 120 ms with a long tail to the right. Markers show p50 120 ms, average 190 ms, p95 840 ms and p99 2.1 s, noting that one user in 100 waits that long. Headline: your average latency is lying to you. Alert on percentiles, not averages.

