

Data-driven crypto analytics | Regime detection • Risk filters • Money flow No hype. No signals. Probability-based insights only.
Joined January 2026
- Tweets197
- Following34
- Followers21
- Likes2



Welcome to @BitDataView
Data-driven crypto analytics focused on market regimes, money flow & real risk management.
No hype. No signals. Just clear, probability-based insights.
Here's what we do differently:
1–2 bp against 20 bp of fees. Not a trade. A better way to read the tape.
Not financial advice. Research log.
#Bitcoin #crypto #orderflow #marketmicrostructure
One of my pre-registered side cuts looked ahead (t −11). Discarded and logged.
The main test starts each order's window after its own 2-minute mark, so it isn't affected.
"The wall broke" isn't a breakout signal. Part of the extra move fades, as you'd expect if impact peaks around 2 minutes and decays.
In a rally prices keep going anyway. That's the trend, not the piercing.

Next 15 minutes, in the order's direction:
After pierced: −1.06 bp
After absorbed: +0.04 bp
Difference: −1.5 bp, t −3.6
Same sign on all three coins. At 60 minutes: −1.8 bp.
The question: when an order pierces (the move still holds at 2 minutes), does the price keep going?
My research partner: yes, from watching the card in a rally.
Me: 40% yes, 35% nothing, 25% reverses.
Pre-registered. The test catches a 0.5 bp effect 88% of the time.
Binance's public trade files. BTC, ETH, SOL, Apr 2023 to Sep 2026.
Same logic as our live card: 124 of 137 windows rebuilt identically.
The coin flip holds over 3.5 years: median day 49.9% absorbed.

Two weeks ago: big orders that push the price fade about half the time, a coin flip. I couldn't show it predicted anything.
So I tracked 1 million of them.
When a big order breaks through, the price doesn't keep going. It gives a little back
Next: a forward test runs daily until January. Does the live code run without look-ahead? Do 80% intervals hold?
Only then does it go near our risk card.
Not financial advice. Research log.
#Bitcoin #crypto #volatility
Fine print:
Edge vs GARCH is clear before the spot ETFs, a tie after.
At 50–100 days the 250-day average ties MSM.
And an old finding of mine, "calm begets calm", turned out to be plain volatility clustering.
At 1 day NATR ties MSM.
It sees intraday highs and lows. MSM sees one return a day.
ATR tells you how wild the last two days were. Not how wild the next month will be.
Round 3: NATR. ATR(14) on 4h candles over price, the "volatility" most dashboards show.
Given its own scale, refitted the same way.
20 days ahead: loses to MSM in 9 of 9 coins (t 4.6). GARCH and the plain average beat it too.

What the edge is: tracking slow changes in the volatility level.
Strip the level out and the edge goes. It does that even in a simulated world where MSM is the true model.
So "level or dynamics" was a false choice.
Round 2: every model refitted every 125 days.
MSM still beats GARCH at every horizon, 1 to 100 days. t 2.7 at 20 days, ahead in 8 of 9 coins.
The stale level had inflated the edge, not created it.

I read it as "MSM only won because it forgets the old level more slowly".
Published "no multi-scale edge".
Too quick.
Round 1, parameters fixed after training:
MSM beat GARCH (t 2.8).
But the plain 250-day average beat everyone. Training-years volatility was 2–4x the test years'. Crypto has calmed down a lot since 2021.
The race, pre-registered:
MSM (multifractal) vs GARCH(1,1) vs HAR vs a plain 250-day average.
9 Binance coins, forecasting volatility 1 to 100 days ahead. Main horizon 20 days, |t| ≥ 2 to call a winner.
Nine days ago I said Bitcoin isn't multifractal.
Then I raced a multifractal volatility model against GARCH on 9 coins.
It won. Just not for the reason the papers give
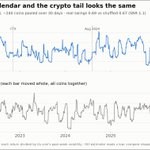
BTC's extreme hourly moves got rarer after Jan 2024 ETFs.
Ran the control: 7 no-ETF coins thinned the same way. Alts moved FIRST — Q3 2023, after BlackRock filed. BTC followed in Q4.
Not the ETFs. The market turned.
reddit.com/r/algotradingcryp…

Next (November): not timing the market doesn't mean it can't pick coins. Do BUY coins beat the market over the same 24h?
Rules are written down. I'll post it whichever way it goes.
Not financial advice. Research log.
#crypto #Bitcoin #quant #algotrading