

Trader | Portfolio Manager 20+ years in global markets Weekly market analysis | FINWEEKLY
New-York, USA
Joined November 2017
- Tweets432
- Following0
- Followers1.2K
- Likes30



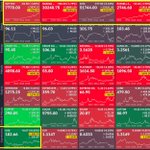


Bitcoin is sitting below $82K. I don't think this calm will last.
Meta and Tesla earnings could be the next major catalysts for BTC.
I'm particularly cautious about Meta. Investors are watching AI spending and revenue growth, and a disappointing report could put pressure on tech stocks.
My scenario: Bitcoin breaks below $80K, with a potential 5-6% market move this week.
The stock market and crypto are more connected than many traders realize.
I'm watching earnings, not just candles.
Ethereum and Solana are approaching levels I wouldn't ignore.
Here's what I'm watching:
ETH
$2,450: potential selling pressure, with roughly $15M in orders.
$2,330–$2,340: a buying zone with approximately $40M in orders.
SOL
$103–$104: the current trading area discussed in my analysis.
$99–$100: a key psychological support zone.
After Solana's recent move toward $120, a return to $100 could offer some traders a significantly lower re-entry.
These are areas I'm monitoring, not guaranteed turning points.
The best trade isn't always the fastest entry.

A massive Bitcoin buy order doesn't always mean someone is bullish.
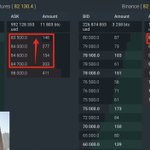
I spotted a 500-contract buy wall around $82K.
But here's what caught my attention:
Large players appeared to be supporting the price while potentially distributing positions between $83.5K and $85K.
On the spot market, I also identified significant buying interest below $79K.
My interpretation?
Some participants may be selling higher and preparing to buy back at a discount.
Watch where the orders move, not just where they appear.

Strategy keeps buying Bitcoin while the market sells its stock.
The company announced its third Bitcoin purchase in October: 267 BTC for about $22 million.
That brings its October spending to $73 million and its holdings to 848,517 BTC, currently worth around $69.5 billion.
MSTR shares gained nearly 2% on Monday, closing around $139. The stock is still down 17% over the past month and 11% year to date.
Strategy also repurchased $193.1 million of its STRC preferred stock, supporting its price after volatility pushed it below the $100 stated amount.
Management continues accumulating Bitcoin while investors sell the stock many have used as a BTC proxy.
Last week, MSCI confirmed it is considering excluding non-operating companies from its indices. Strategy could be an obvious candidate for removal.
Strategy is still buying Bitcoin. The market is questioning the stock built around it.
The market usually takes the cheaper liquidity first.
My base case is a sweep of the $80,500–$79,500 long liquidity before BTC attempts a move toward $84,500.
If $79,500 fails to produce a strong reaction, then $87,500 becomes irrelevant for now. Liquidity shows where price may be attracted—not where it must reverse.

$BTC has 2 large long-side liquidity around $79,500 and $80,500.
BTC has 2 large short-side liquidity around $84,500 and $87,500.
Where do you think Bitcoin will go first?
This was not a broad market crash. It was a forced exit from the most crowded trade on Wall Street.
The S&P 500 fell 1.09% on Friday to 7,659.44, ending the week down 1.95%-its worst weekly performance since June.
The Nasdaq took a much harder hit:
▪️ Nasdaq Composite: -2.15% Friday, -4.48% for the week
▪️ Russell 2000: -3.05% for the week
▪️ Dow Jones: +0.67% for the week
That split tells the story. Capital moved out of growth and risk and into value and safety.
The selling was focused and professional.
Concerns over AI financing triggered the move. CoreWeave lost a quarter of its value in one week, while its bond yields climbed above 15%. Investors suddenly had a reason to sell anything carrying the AI label.
The semiconductor ETF SMH fell 10.5%.
Lam Research dropped 17.2%.
Micron fell 14.6%.
Intel lost 14.2%.
According to Goldman Sachs, hedge funds sold global AI-related stocks for five consecutive sessions, reversing all their net purchases since the start of 2025.
But this was not a new bearish bet.
Long positions were sold roughly 3.5 times more aggressively than shorts were added. Funds were reducing risk, not positioning for a complete market collapse.
The macro backdrop offered no relief.
Hotter consumer and producer inflation pushed the probability of a December rate hike to 74.3%. Brent crude jumped 3.7% on Friday to $109.86 as an agreement with Iran remained out of reach.
The VIX rose from 14.84 to 20.16.
At the same time, money moved into Treasuries, pushing the 10-year yield down from 5.24% to 5.09%.
Here is what most headlines missed:
Investors were not selling everything. They were changing what they wanted to own.
Consumer staples gained 5.0%.
Energy rose 4.9%.
Healthcare added 3.5%.
The equal-weighted S&P 500 actually gained 0.5%, while the market-cap-weighted index fell about 2.0%.
The weakness was concentrated in the expensive technology names that had been carrying the index.
I warned that tech was trading far above its long-term valuation range and that capital would eventually rotate from growth into value.
That rotation arrived sooner than expected.
Bob Farrell’s second rule says that excess in one direction eventually produces excess in the opposite direction.
The AI trade became overcrowded. Now that excess is being unwound exactly as crowded trades always are.

Even strong earnings may not be enough for this market.
In the latest issue of THE MONEY, I break down what is driving the sell-off in tech stocks and why next week could put the market to the test.
I’m watching to see whether this is a temporary rotation or the start of a bigger move.
I look at capital flows and sentiment among major market participants, why AI financing is becoming a concern, and which earnings reports and events could move markets.
I also share key S&P 500 levels, my scenarios for the week ahead, and how I’m preparing for volatility across stocks and digital assets.
A bounce can fail, and a sell-off does not automatically end a rally. I focus on the signals that may help tell the difference.
The free issue is linked in my first reply.

The S&P 500 reached a new all-time high last week. On the same day, more stocks hit new lows than new highs.
That’s rare. Since 1970, it has happened only a handful of times: in 1972, 1999, early 2020, late 2021, and 2024.
An immediate improvement rarely followed. More often, volatility picked up and the index began to weaken.
I wouldn’t use this as a sell-timing signal. But when key companies are falling while the index keeps rising, risk management deserves more attention.
For the full data and analysis behind my market decisions, join the premium subscription.

Buying the dip does not always mean buying cheap.
In the latest issue of FINWEEKLY, I look at the digital asset market as US stocks sell off, why I am not rushing to buy, and the scenarios I am considering for next week.
I cover what on-chain data says about demand and BTC holders, where large players are placing bids and why those orders alone are not enough to justify an entry, and which signals could separate a temporary bounce from a real recovery.
I also share my buy, sell, and stop-loss levels for BTC, ETH, XRP, and SOL, plus what I am watching ahead of the US elections.
My plan is to define the conditions for a trade in advance and know when to stay on the sidelines.

🛢 Oil is becoming a problem again.
WTI reached $101.91 on October 14, up 7.3% in just one week. It is now trading above 92% of its levels this year.
After another hot CPI report, this is probably the last thing the Fed wanted to see.
Oil above $100 means higher transportation and production costs. Eventually, those costs reach consumers and make inflation even harder to control.
I see two possible scenarios from here.
There is roughly a 60% chance that oil stays near $100, the Fed keeps its hawkish tone, the dollar remains strong, and risk assets continue to struggle.
The other 40% is a sharp oil correction that weakens the inflation narrative and gives markets some relief.
For now, as long as WTI remains above $95–$100, I see it as a clear headwind for Bitcoin and the Nasdaq.
This is not the time to relax.
Two major holder cohorts are currently sitting on coins with a cost basis above the market price.
Bitcoin purchased 6–12 months ago, during the late stages of the 2025 rally and the subsequent decline, has an average cost basis of around $88,000.
Coins acquired 1–2 years ago carry an even higher cost basis of approximately $100,000.
Both levels have already rejected Bitcoin this year.
In January, BTC rallied toward the 6–12-month holder cost basis before falling by more than one-third. In May, it reached the 1–2-year holder cost basis and then declined by roughly 25%.
The 1–2-year holder cohort also increased selling as the October rally began.
Until Bitcoin breaks decisively above $88,000, every new rally is likely to face holders looking to sell near their break-even price.

🇺🇸 US inflation is rising!
💸 Stocks are down 1–2%.
- The dollar is rising.
- Oil is rising.
- Gold is falling.
- Crypto is falling.
The conclusion is simple: cash is king today.
More speculators are realizing that a period of major turbulence may be approaching. If you are sitting on profits in open positions, today may be the right time to lock them in.

The Ethereum level everyone can see may be the exact level the market trades through.
Around $2,150, ETH has a clear historical support zone. That makes it an obvious place for buyers to enter and place stops just below $2,000.
Obvious trades attract crowded positioning.
If enough traders buy the same support with the same invalidation level, larger capital has an incentive to push price beneath those stops before building a position. A brief break below $2,000 would not automatically mean the structure is dead.
It could be where the real accumulation begins.
The order books support that risk. On major spot venues, a large share of visible whale bids sits at $2,000 or lower. Futures liquidity near $2,490 and $2,430 may slow the decline, but it does not prove that current prices are the final bottom.
Whale bids are areas of interest, not promises that price will reverse immediately.
My scenario is simple: first, ETH tests roughly $2,160. Then it may bounce 10% to 15%. After that, November or December could still bring a sweep below $2,000.
The lesson is not to trade blindly against support. It is to know where everyone else's stop is likely sitting.

The biggest threat to Ethereum may not be crypto at all. It may be oil and the US dollar.
My Q4 oil scenario is $110 or higher. If supply tightens and fuel prices rise, energy absorbs capital, inflation pressure returns, and financial conditions become harder for risk assets.
At the same time, the US Dollar Index has broken a resistance trend that held for roughly eighteen months. The key area is near 102. If DXY extends toward 104 to 106, US stocks and crypto could face a much deeper correction.
That combination matters.
More expensive energy pressures consumers and businesses. A stronger dollar reduces global liquidity. Higher yields make investors less willing to pay for distant growth and speculative upside.
Ethereum does not need a crypto-specific disaster to fall. It only needs capital to find safer or more attractive places elsewhere.
A bullish crypto narrative cannot overpower a hostile liquidity cycle forever.
This is why I do not expect a clean Q4 rally to $5,000. My base case remains a move toward $2,160, with the $2,100 to $2,000 region becoming the real test.
The chart can look bullish while the liquidity backdrop turns against it.


The S&P 500 may be near record highs, but the rally is being carried by a narrow group of technology and semiconductor giants. Beneath the index, many companies tied to real goods and services are already under pressure.
That matters because a strong headline index can hide weak market breadth.
At the same time, consumer confidence remains depressed, oil is rising again, and the dollar is testing a major resistance area near 102. None of these factors guarantees a crypto sell-off on its own.
Together, they create a liquidity problem.
If the dollar continues higher and energy absorbs more capital, speculative assets will have to compete for what remains. Ethereum can still bounce, but a sustained move to $5,000 requires far more than a clean chart breakout.
That is why I want macro confirmation before treating any rally as a new trend.
Before buying a crypto narrative, I check where global liquidity is actually moving.

ETH at $5,000 this quarter is the forecast everyone wants to hear. I see the opposite risk.
Ethereum is trading near $2,500 after breaking out of its long descending channel. That makes a 100% rally sound possible, but price does not move on excitement alone.
Crypto competes for the same liquidity as stocks, commodities, bonds, and the dollar. Right now, those markets are creating more headwinds than fuel.
My key ETH level is $2,150. It has acted as an important reference zone in 2022, 2024, and twice in 2025. Above $3,200, I see distribution. Below $2,100, I see the beginning of accumulation.
At $2,500, ETH is trapped between those zones. Patience matters more here than conviction.
My base case for Q4 is a move toward $2,160, followed by a possible 10% to 15% bounce. But if that support breaks, the market could briefly push below $2,000 before a stronger recovery begins.
That move would not invalidate Ethereum. It would clear leverage, trigger crowded stops, and transfer positions from impatient traders to larger capital.
I am not chasing the loudest target. I am waiting for the level where real demand is more likely to appear.

The market is setting new records, but the equity risk premium has turned negative.
In the latest issue of THE MONEY, I explain what is driving the S&P 500 to fresh highs, why earnings season is beginning with an exceptionally high bar, and what investors should watch as bonds compete with equities for capital at yields near multi-year highs.
Inside this issue:
▪️ The week’s key events: banks, inflation, the Fed, and oil
▪️ Key S&P 500 technical levels and potential market scenarios
▪️ Why the current rally remains narrow and what it reveals about the market’s underlying health
▪️ What a negative equity risk premium means and why it matters to investors
▪️ My approach to managing risk and cash ahead of earnings season
Read for free → link in BIO 🔗
Subscribe so you don’t miss next week’s issue!

Exactly one year ago, on October 10, crypto suffered the largest liquidation event in its history.
$19.2 billion in leveraged positions were liquidated.
1.6 million trading accounts were wiped out.
Perpetual futures open interest collapsed by as much as 43%.
I remember watching the market that day.
Some altcoins lost more than 75% of their value within minutes.
But what happened next was even more revealing.
Market makers reduced risk.
Liquidity disappeared.
Traders became far more cautious with leverage.
One year later, liquidity in the Bitcoin and Ethereum order books has recovered.
Many altcoins still have not.
Only 8 of the 50 largest crypto tokens are trading above their October 10, 2025 levels.
That day showed how quickly liquidity can vanish when everyone needs to sell at the same time.
The market has recovered in some ways.
But the weaknesses exposed that day, including concentrated leverage and thin liquidity, have not disappeared.
October 10, 2025. A day crypto traders will never forget. 😎
That is exactly why I recommend using a stop-loss order on every short-term or day-trading position.

The S&P 500 gained 1.1% this week, closing Friday at 7,811.54, just below Tuesday’s record close of 7,818.93.
The Dow Jones added 0.9%, while the Nasdaq Composite rose 0.6%. Small-cap stocks, however, fell nearly 1%, showing that market strength remains concentrated in larger companies.
🟡 Last week, Treasury yields reached levels not seen relative to equity earnings yields since 2002. On Wednesday, the 10-year Treasury yield climbed to its highest level since 2002 before retreating to around 5.25% following strong demand at the Treasury auction.
🛢 Brent crude remained above $100 after President Trump said the US would not strike Iran before the midterm elections.
The main focus now shifts to the third-quarter earnings season, which begins Tuesday with results from major banks.
❗️ Wall Street has done something unusual this quarter: it raised the bar.
According to FactSet, Q3 earnings estimates increased by 1.4% during the quarter. Over the past five years, estimates have typically fallen by an average of 2.2% during the same period.
A record 72 companies issued positive guidance, while expected S&P 500 earnings growth has climbed to 29.6%.
The market is entering earnings season near record highs, with expectations rising rather than falling. That leaves companies with very little room for disappointment.
Ben Bernanke literally explained why markets rarely break when the first warning appears. It is not one bad data point. It is not one falling sector. It is tightening financial conditions spreading quietly until liquidity becomes fear.
Higher rates begin as a price.
Borrowing becomes more expensive. Bond values fall. Refinancing gets harder. Banks protect their balance sheets, credit standards tighten, and companies delay investment.
None of this needs to cause an immediate crash.
The system can look stable while pressure moves from bonds into banks, from banks into businesses, and from businesses into employment and consumption.
Then one failure changes behavior.
Investors stop asking what an asset is worth in normal conditions. They ask how quickly it can be sold and who else needs cash at the same time.
That is when a valuation problem becomes a liquidity problem.
A record index can therefore coexist with growing stress underneath it. Markets often celebrate the last strong price long after the transmission mechanism has begun working.
The warning is not that high yields guarantee a crisis.
It is that financial stress compounds before it becomes visible.
Bernanke's full university lecture is free online. Almost nobody watches it until the system is already under pressure.

