Pinned Tweet
Spotting a spread is easy. Knowing whether it’s worth trading is the work.
I’m building ArbSpread to put prices, depth, funding and spread history in one place.
CEXs + perp DEXs. Free market data. No account needed.
Research, not auto-trading.
arbspread.com
Two venues. I don’t add their volumes.
My route volume uses the smaller 24h figure. Depth stays separate: past trading isn’t liquidity waiting for me now.
AXIS · 23 Oct, 06:31 UTC. Before fees. Funding is projected, not earned. Not a trade I took.
I’d rather leave a hole in a chart than hide a hole in the data.
In my spread history, missing observations stay missing. I don’t shift later points back or fill in the gaps.
A smoother line isn’t always a better answer.
A 90-hour spread isn’t a 90-hour win.
This ZIL snapshot makes me ask why the gap persists—not assume it will close when I need it to.
I flag long-running spreads in my scanner. A timer isn’t a track record.
Before fees. Not a trade I took.
Same funding rate. Different clock.
Two matching percentages can still mean a payment on one leg before the other settles.
That’s why I keep settlement times beside the rates in my scanner. A rate difference alone misses the clock.
“BEST” at what?
In my scanner, it means the biggest ask-to-bid spread—not the best net outcome.
Funding, fees, depth and the exit can change the choice. I want the ranking to start the research, not finish it.
MEW snapshot · 21 Oct, 06:38 UTC. Not trade PnL.

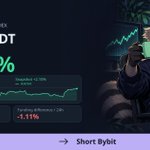
ALT ArbSpread MEW/USDT route snapshot at 06:38 UTC on 21 October 2026. Long OKX, short Bybit. Ask-to-bid spread +2.10% before fees; 6h 16min above 0.2%. The card labels funding difference / 24h as -1.11%; this is not trade PnL. A six-hour chart combines candle-close history and saved ask/bid observations. A raccoon illustration is on the right.
The smallest detail I care about in a scanner: ≥.
In my depth column, it means the venue returned only part of the requested range. A lower bound—not an exact total.
I’d rather show the limit of the data than make an incomplete snapshot look complete.
+2.65% looks better than +0.94%.
One is 24h at current funding rates. The other is the route’s settled funding over the past 24h.
I want that difference obvious before anyone reads the bigger number as a result.
LRC snapshot. Funding only, not trade PnL.
Zero trading fees. Still a $12 bill.
I set all four fees to zero in ArbSpread’s farming calculator. Spread, slippage, net funding and transfers stayed.
I want the full-cycle cost visible before the points look like profit.
The spread was over 2%.
Depth within 0.2%? Just tens of dollars.
And a delisting warning.
I want those details visible in ArbSpread before the green number starts looking like a trade.
The spread doesn’t care whether the venue is a CEX or a DEX.
So I stopped splitting the search.
ArbSpread now shows both in one view, including CEX → DEX routes.
Find the route. Then check whether it’s worth trading.
Green funding. Red entry spread.
That combination is why I keep both numbers together in ArbSpread.
The funding figure is a forecast at current rates. The entry spread is the price gap now. I want to see both before deciding whether a hedge deserves a closer look.
A pair gets delisted. The chart shouldn’t vanish with it.
I’ve added delisting labels to ArbSpread. Saved charts stay available up to the last recorded quote.
I still want to see how an idea ended — even when the route is gone.
The spread looks great. Then you increase the order size.
Thin books can eat the edge before fees even enter the picture.
That’s the question I’m building ArbSpread around: not “how big is the spread?” but “how much can I actually trade at that spread?”
A clean interface can make a messy trade look simple.
That bothers me as I build ArbSpread.
One green number. Two venues. Separate balances. Different liquidation risks.
I want to remove the tab-hopping. Not hide what can go wrong.
Less friction shouldn’t mean less context.
The awkward part of building an arbitrage scanner: sometimes the honest result is an empty screen.
Looser filters make the product look busier. They don’t make the market better.
With ArbSpread, I want “nothing worth a closer look” to be a useful result too.
Spotting a spread is one thing. Deciding when to close is another.
I’m building virtual trades in ArbSpread to test an entry, an exit rule, and what happens in between.
No real funds. A simulated result doesn’t mean I’d get the same fills live.
You shouldn’t need a subscription to find out if a tool is useful.
That’s why ArbSpread’s core market data is free. No account needed.
Check spreads, depth and funding first.
I’d rather earn a bookmark than ask for your email before showing anything useful.
I’m building a spread scanner. The biggest % is the number I question first.
This snapshot: 2.12% before fees.
But at what size?
That’s what I want ArbSpread to answer better: not the biggest gap, but what’s left at my size.
What size would you check first?