

AtlasOnChain — Trading education Trading patterns daily Learn. Trade. Profit.
world 🌍
Joined January 2026
- Tweets3.4K
- Following383
- Followers5.5K
- Likes6.3K





In this THREAD, I’ll break down 4 important Price Action concepts:
1. Market Structure Shift (MSS)
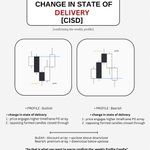
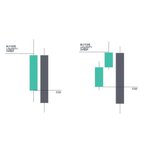
2.Change in State of Delivery (CISD)
3.Fair Value Gaps (FVGs) & Liquidity Sweeps
4. Draw on Liquidity


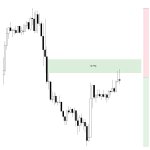
3.1 Fair Value Gaps & Liquidity Sweeps
A liquidity sweep happens when price moves beyond a key high or low, triggering orders resting around that level.
These moves can collect liquidity before price reverses or continues in its original direction.
Instead of entering immediately after a sweep, observe the reaction and look for confirmation before considering a trade.

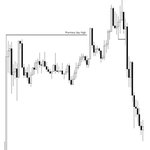
4. Draw on Liquidity
Draw on Liquidity (DOL) refers to the price level or area that the market may be attracted toward because of available liquidity.
This could include previous highs, previous lows, equal highs, equal lows, or other significant liquidity pools.
Identifying the likely liquidity target helps traders establish directional bias and plan potential trade setups.

ICT 4-Hour Model
Every 4H candle tells a smaller story on the lower timeframes.
Here’s the typical sequence in a bullish 4H candle:
1. Accumulation
Price opens and moves sideways or slightly higher, building a small range.
2. Manipulation
Price sweeps below the 4H open (or recent lows), grabbing sell-side liquidity. This is the fake move that forms the 4H low.
3.Displacement + FVG
Strong bullish candles reverse the move, break previous structure, and leave a Fair Value Gap.
4. Expansion
Price retraces into the FVG, holds it, then expands toward the 4H high.
How to trade it:
- Mark the 4H open
- Wait for the liquidity sweep below it
- Confirm displacement and a clear FVG on the 1m / 5m / 15m
- Enter on the retracement into the FVG
- Stops go below the manipulation low
- Target the 4H high or next external liquidity
No sweep = no setup.
No displacement = no entry.
The model works the same in reverse for bearish 4H candles.
Simple. Repeatable. Built entirely on liquidity, structure, and imbalance.


ICT Concepts
1. Liquidity
Liquidity sits at swing highs and swing lows.
These are the areas where stop losses and limit orders cluster.
- Buy-Side Liquidity (BSL): above swing highs
- Sell-Side Liquidity (SSL): below swing lows
The market often hunts these levels first before delivering in the true direction.
2. Fair Value Gap (FVG)
A three-candle imbalance where price leaves a gap between the first and third candle.
- Bullish FVG (BISI): forms in uptrends and acts as support
- Bearish FVG (SIBI): forms in downtrends and acts as resistance
Price frequently returns to fill or react from these inefficiencies.
3. Order Block
The last opposing candle before a strong displacement.
This is where institutions accumulate or distribute.
- Bullish Order Block: last down-close candle before a rally
- Bearish Order Block: last up-close candle before a sell-off
Price often revisits these zones before continuing.
4. Breaker Block
When an Order Block fails, it becomes a Breaker.
- Bullish Breaker: failed bearish Order Block that later acts as support
- Bearish Breaker: failed bullish Order Block that later acts as resistance
Failed Order Blocks often turn into high-probability continuation zones.
Master these four.
Everything else in ICT builds on top of them.


How to Mark and Confirm a BOS
There are a few ways to map a Break of Structure.
Most traders (myself included) use Type 1.
The rule stays simple:
A true BOS requires a candle body close beyond the previous swing high or low.
A wick through the level is just a liquidity sweep.
It does not confirm structure.
Once the body closes through, the old high or low is no longer protected.
That is the shift.
Test the different mapping methods.
Keep the one that stays consistent with your process.

Most traders lose money because they skip higher timeframe context.
If you don't use 3 timeframes together, every setup looks valid—until it fails.
Here is the exact framework to pair timeframes for high-probability setups:
1. Timeframe Roles
- Higher TF → Directional Bias & Key Levels
- Middle TF → Setup Trigger & Confirmation
- Lower TF → Entry, Risk & Execution
2. The 3 Pairings
- Swing Model: Weekly → Daily → 4H
- Intraday Model: Daily → 1H → 15M
- Scalping Model: 1H → 15M → 5M / 1M
3. The Step-by-Step Execution
- Daily: Price raids Sell-Side Liquidity (SSL) and forms a swing low, leaving a Fair Value Gap (FVG) targeting equal highs.
- 1-Hour: Wait for price to react inside and respect the Daily FVG (do not chase early).
- 15-Minute: Watch for internal liquidity raid + strong displacement + FVG aligning with a bullish Order Block (OB).
- Entry: Place stops below the swing low and target the higher timeframe draw on liquidity.
HTF gives you the direction. LTF gives you the discount.
Bookmark this for your next session. 📌
Market Maker Buy Model – Full Walkthrough
Sellside of the Curve
Price consolidates, then expands lower.
The move targets Sellside Liquidity, sweeping stops and trapping late sellers.
Smart Money Reversal
At the lows, institutions step in.
You see a clear Market Structure Shift, new Order Blocks, and Fair Value Gaps forming.
This is the turn.
Buyside of the Curve
Price expands higher.
It mitigates breakers, reclaims Order Blocks, and fills imbalances on the way up.
The objective becomes the higher-timeframe premium and buy-side liquidity.
The model is simple once you see the sequence:
Distribution down → Reversal at the low → Expansion higher.
Stop hunting liquidity first.
Then follow the smart money turn.

Market Maker Buy Model (MMBM)
This is the classic sequence ICT teaches on the 5-minute chart.
1. Consolidation near the highs
2. Distribution — smart money sells into strength (red arrows)
3. Smart money reversal and shift
4. Low-risk buy in the discount zone (imbalance / FVG)
5. Accumulation of longs
6. Secondary buy at the consequent encroachment (midpoint of the gap)
7. Order block support holds
8. Expansion that runs straight into buyside liquidity
The model is not about catching the absolute bottom.
It is about waiting for the distribution to complete, confirming the reversal, then entering where risk is defined and the path of least resistance is higher.
Once the structure shifts and price reclaims the imbalance, the objective becomes clear: clear the old highs and take the liquidity above.
Balanced Price Range (BPR)
When two Fair Value Gaps overlap, you get a Balanced Price Range.
This forms when sell-side delivery is followed by buy-side delivery. The opposing imbalances cancel each other out and create a balanced zone.
Price often leaves this area, then returns to it later.
Because the range has already been balanced, it frequently acts as support (or resistance in the opposite scenario).
In the example, price returns to the BPR and holds, offering a clean long entry with the expectation of a move higher.
Overlapping FVGs are not just noise.
They create high-probability reaction zones once price has left and come back.
Imbalance Types.
Normal Imbalance
Aggressive buying leaves a gap between the high of candle 1 and the low of candle 3.
Price often returns to fill the imbalance before continuing in the original direction.
Inverse Imbalance
A strong opposing candle creates an imbalance against the prior move.
This zone frequently acts as a retest level before price continues in the new direction.
Combined (Inverse + Normal)
When both appear together, the inverse imbalance and the normal imbalance sit side by side.
This confluence often creates a high-probability reaction zone.
Imbalances are not just gaps.
They are areas of unfinished business.
Price tends to revisit them.
How it reacts when it gets there tells you the next move.