

Financial market analysis Analyse des marchés financiers #bonds #Currencies #cac40 #sp500 $hsi #volatility $VIX #MOVE
- Tweets4.3K
- Following13
- Followers212
- Likes275
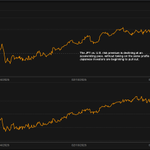
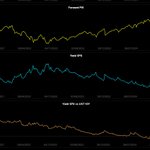





ALT A financial report titled "Weekly Market Commentary" from the Macro Volatility Digest, dated October 12, 2023. The report discusses market volatilities and the S&P. The left column provides a detailed commentary, and the right column contains two exhibits. Exhibit 1 is a line graph showing Cross-Asset Vols versus Yield Reprieve. Exhibit 2 is a chart depicting changes in the 2020 ETF Skew. At the bottom right, there's a scatter plot illustrating stock dispersion and return correlation. Contact information is provided for an editor.

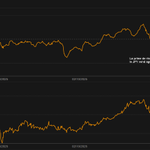
ALT This image is a report titled "Macro Volatility Digest" from Cboe, dated October 12, 2020. It features six line graphs in the "Cross-Asset Volatility Monitor" section, displaying data for Equity, US Credit Vol, Commodity Vol, Oil Vol, Credit Vol, and USDEMFx Vol, all highlighting realized volatility over time. Below these graphs is the "Cross-Asset Volatility Snapshot (10Y Lookback)" graph, comparing historical volatility across different asset classes. Contact information for Edward X. Tom is included at the bottom.

ALT The image is a page from the "Macro Volatility Digest" by Cboe, dated October 12, 2020. It features several line graphs representing equity credit correlation for weekly, monthly, and quarterly intervals. Below is a colorful cross-asset correlation matrix chart labeled "1M." At the bottom are contact details for Edward K. Tom, Sr. Dir. of Derivatives Market Intelligence.