

Founder of ALPHA INSIGHTS, a weekly publication analyzing global equity markets for changing leadership trends emphasizing actionable long & short stock ideas.
Not Financial Advice
Joined August 2018
- Tweets1.3K
- Following30
- Followers2.3K
- Likes390




Pinned Tweet
🔥 Hot Off The Press! 🔥
HUGE INSIGHTS: The Big Picture - Issue #62
"Irrational Exuberance...The Sequel"
Please enjoy the free portion of the attached monthly investment newsletter with our compliments! Click the l!nk in the comments section:

Jeffrey W. Huge, CMT retweeted
Stock market is over-concentrated, overhyped, over-leveraged, overvalued, and over-owned!

"I Got Booed for Raising Cash": Jeffrey Huge Says This Feels Like 1999 @Alpha_Insights financialsense.com/podcast/2…

Stock market is over-concentrated, overhyped, over-leveraged, overvalued, and over-owned!
"I Got Booed for Raising Cash": Jeffrey Huge Says This Feels Like 1999 @Alpha_Insights financialsense.com/podcast/2…
Jeffrey W. Huge, CMT retweeted

.@DanielTNiles says AI-related stocks are driving the S&P 500’s headline performance as he weighs the bull and bear cases for the AI trade.
He questions how sustainable today’s elevated earnings and margins are.
While some investors are “hyper bullish” about those levels continuing for years, Niles says, “I just don’t think that’s going to be the case.”
For more: schwabnetwork.com/?CID=SM:Tw…
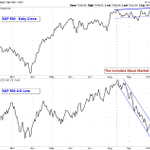
The S&P 500 posted a new ATH today.
Yet, as of October 2nd, 82% of the constituents of the benchmark index were down >10% from their 52-week high; 59% were down >20%; 41% were down >30%; 26% were down >40%; and 17% were down >50%.
The S&P A-D Line is in freefall even as price makes a modest new high.
In short, there has been an invisible stock market crash!

Investors should ignore this advice at their own peril.

Last wk, oil fell 1% w/ lower than expected JOLTS, PCE & NFP. But bonds sold off even more driving 10/30yr ylds to 2002 levels. Equity mkts though were flattish driven by AI infrastructure w/ SOX +3.7%. Breadth worsened to just 25% of the S&P above the 50dma.
The market action on Friday bothered me. Non-farm payrolls came in at 29K vs 90K expected. Bonds initially rallied from oversold levels at the open but ended the day down across the curve from the 3-month to 30 year driving yields higher. The dollar did close lower by $0.16 on Friday but it was still up $0.96 during the week. The USD has surged by over $3 in less than a month and broke above $102 on Thursday.
As I wrote about in my post last Sunday, I am concerned that the Fed is raising, while inflation has remained higher than target with oil prices remaining high. There have been five episodes of ~20%-50% S&P sell-offs since the early 1970s on this combination.
I can now add to that list of concerns a sovereign debt crisis like in 2010 or an LTCM event like in 1998 driven by the combination of a strengthening US dollar and global bond market sell-off.
On the positive side, the AI infrastructure trade added more demand drivers last week. OpenAI introduced their Muse by $META competitor called Dots. $GOOGL previewed their new LLM model Argon that ranks higher than Anthropic and OpenAI on most benchmarks.
At the company level, $NVDA, sounded great during their marketing in NYC. The stock trades at a 15x CY27 PE for guided 70% revenue growth which I think could be revised higher when they report results in mid-November. To me, Nvidia is the best risk adjusted AI trade in the market now that Meta gained 27% in September. In this vein, while the SOX Index is down 10% from 6/22 which was the peak of the momentum trade, Nvidia is up 12%.
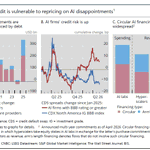
On the negative side, I have been watching the Ramp Index of total token spend by businesses for some time to make sure that token growth is outpacing the ASP decline. But after increasing by 9.1x year-to-date through August 2nd, it has been roughly flat to down since then. There has been a 11% combined decline in Anthropic plus OpenAI spend from 8/2-9/27. Meanwhile on a token basis, there was a 11x year-to-date increase through August 2nd with a further 28% increase from Anthropic plus OpenAI since then. Is this the impact of open-weight model pricing?
Finally, the current bi-partisan (amazing they agree on anything) pushback on datacenters could get worse after November 3rd mid-terms if there is a blue wave which is what the current polling data leans towards.
On July 29th, I turned bullish again: “In summary, my view is that we could have seen at least a short-term bottom today with a strong rally ahead of us in the sectors most caught in the latest speedbump.”
On August 23rd, I started to get more cautious again on the overall market with my post, James Carville: “as the bond market. You can intimidate everybody.” But since then, despite a 54 bps surge in 10yr bond yields, the Fed resuming hiking after 3 years, a 3.2% increase in the USD, the equal-weighted S&P down 5.4% and breadth returning to levels last seen in March, the overall S&P has gained 0.6%.
In summary, I feel like either the bond market (and now the currency markets) are not priced correctly or the stock market isn’t. As a result, I believe in extra prudence. That means being more selective (such as AI infrastructure), having smaller position sizes and a greater than normal amount of cash. Maybe this is the new normal for bond yields vs the stock market PE, but that is not my base case.
Best of luck in the week ahead.
Would you rather be:
Out of the market wishing you were in (e.g. 2000, 2007, 2019, 2021), or
In the market wishing you were out (e.g. 2001, 2002, 2008, 2020, 2022)?


100%Out...wishing I was in.
0%In...wishing I was out.
1 votes • Final resultsYep!

As discussed in our September monthly investment newsletter, HUGE INSIGHTS: The Big Picture, 10-year Treasury yields were poised to continue their ascent...And ascend they have — hitting 4.95% so far today...From our lens, a sustained bullish inflection above 5.0% would target 5.65% for the T-note yield longer-term.

As discussed in our September monthly investment newsletter, HUGE INSIGHTS: The Big Picture, 10-year Treasury yields were poised to continue their ascent...And ascend they have — hitting 4.95% so far today...From our lens, a sustained bullish inflection above 5.0% would target 5.65% for the T-note yield longer-term.
🔥Hot Off The Press! 🔥
HUGE INSIGHTS: The Big Picture - Issue #61
"Outrageous Fortune"
Please enjoy the free portion of the attached monthly investment newsletter with our compliments! Click the l!nk in the comments section:

#NVDA reported its quarterly financial results yesterday covering the second quarter ended July 2026 (fiscal Q2 2027).
While the headline numbers showed extraordinary top- and bottom-line momentum — revenue reached $96.22 billion (up 106% YoY) and net income surpassed $53.95 billion — the report highlighted several balance-sheet and operational headwinds.
The most material negative change in NVIDIA's financial condition was the sharp sequential contraction in operating cash flow caused by deteriorating working capital metrics.
1) Operating Cash Flow Plunge: Cash flow from operations dropped over 52% sequentially from $50.3 billion in Q1 to $24.1 billion in Q2, even as reported net income grew.
2) Surging Receivables and Extended Terms: Accounts receivable reached $63.1 billion and Days Sales Outstanding (DSO) increased from 45 days to 60 days. Management noted this was due to extended payment terms granted on large, multi-quarter enterprise agreements for data center infrastructure.
3) Inventory Buildup: Total inventory rose to $31.6 billion (up from $25.8 billion sequentially) to support component commitments and preparations for the Vera Rubin architecture rollout, tying up substantial liquidity.