
@Alpha_Ex_LLC
Account based inUnited States
About this account
- Account based in
- United States
- Connected via
- United States App Store
Account-level information from X, not a live location or the device used for a specific post.
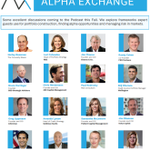
Alpha Exchange is a podcast series by Dean Curnutt to explore topics in financial markets, risk management and capital allocation in the alternatives industry
Joined February 2020
- Tweets5.7K
- Following1.1K
- Followers22.2K
- Likes108


Pinned Tweet
Charts referenced in most recent pod:
“The Market Disregards Correlation”
Apple:
podcasts.apple.com/us/podcas…
Spotify:
open.spotify.com/episode/772…


reposting from 9/29 on the premium of $TLT vol to $SPX vol...this normalized as expected. at the start of the month, you could have sold a 10/23 straddle on the TLT and bought a 10/30 straddle on the SPX, getting paid a small net premium on the spread trade. you'd have isolated the 10/28 FOMC as a catalyst on your long vol position. currently, that SPX straddle now has a premium of 100bps over the TLT straddle.
xitter.cf/Alpha_Ex_LLC/status/21…


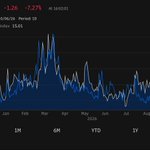
The chart below shows the (common) upward slope to the SPX implied vol termstructure. The same is shown for the TLT, a near mirror image, and downward sloping.
Inverted termstructures, like inverted yield curves, don't last for that long. They are associated with high levels of realized vol, which fund the purchase of gamma, most prominent in short-dated options. In plainer terms, inverted termstructures reflect disequilibrium. All of the major macro vol events have featured curve inversions. The process of finding equilibrium is about normalizing and disinverting that curve.
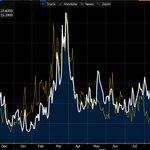
Second chart shows just how joined at the hip the SPX and TLT are. The second chart suggests that the first chart should look different. By this account, either TLT vol is too high or SPX vol is too low. That spread ought to narrow. I'd argue that things getting worse for the bond market could be at a tipping point of making things considerably worse for the SPX.


It being October 19th and with the premise that "we learn the most about markets by studying episodes when things go horribly wrong", I am resharing my retrospective episode on 1987's Black Monday.
Some excellent Alpha Exchange guests featured in this... @biancoresearch @dampedspring @BookstaberRick @barryknapp @RenMacLLC @HarryMarkopolos
podcasts.apple.com/us/podcas…

TLDR: it's not always "short gamma", but perhaps there is something to it this time in explaining the outsized move in the $VIX on Friday.
Have seen some good discussion on the behavior of the VIX on Friday when it had a move that far outstripped what would have been expected given the relatively modest move lower in the SPX.
Typical VIX beta per 1% move in SPX is 5-10. at one point on Friday, the VIX was up almost 30% on down 60bps in the SPX. that's way out of line vs history.
The next question is "why?" here we can approach from two ways. first, "new news"...ie, what did the market learn that put it in risk-off? we can advance all of the usual suspects...pod unwinds, crude, Coreweave, etc.
But why such a strong move in VIX relative to SPX? I am always careful to advance the stock answer of "positioning" as a cause. In the derivs space, it can't always be "gamma did it"...there are just so many cross-currents that complicate getting a true read.
In the limit, it's as clear as day that positioning did do it on the volmagedon day of Feb 5, 2018.
Friday is nothing like that, but it could be the case that dealers hedging Oct VIX calls that they were short might have exacerbated the move. I can say with certainty that dealers are short a substantial amount of these. they are short "VIX gamma" --> they are short calls, long VIX futures and forced to aggressively buy VIX futures as the Oct VIX future rises and the delta on the calls they are short quickly rises.
I've simulated this below using the Oct 20 call. assuming a "hedger" was short the call and long Oct VIX future, I show how the hedger would have had to buy and sell VIX futures as the option delta moved. you can see the delta gap from 0.2 all the way to almost 0.7 in a hurry, requiring rapid buying of futures to stay delta-neutral. that delta then quickly falls to 0.4, requiring unwinding of those futures.
from the 17 to 25 strike, there are 1.8mln Oct calls open. we have to be careful not to double count, as these could be parts of spreads (ie, the Oct 17-22). we also don't really know how they are being risk managed. it's naive to think that the long side doesn't hedge but the short side does. we also have no insight on all the "dark matter" in VIX...that is, the substantial exposures that result via sell-side QIS desks.
It's always very difficult to disentangle the "why" of an outsized move. That said, I'm more open-minded than usual that positioning, coupled with timing (this occurred right near Oct expiry, creating an especially large amount of short VIX gamma) may have played a role.
We will see what happens Monday!

Six stressors:
Correlation
Concentration
Inflation
Duration
Valuation
Polarization
In words…
“Today's market faces six stressors: a correlation shock that could erase diversification overnight, extreme concentration with the top 10 stocks making up 40% of the S&P 500, valuations priced for aggressive earnings growth, duration risk in long-dated government bonds, inflation that refuses to fully normalize, and a level of political polarization that makes policy itself a source of volatility.”
TLDR: movement in the $VIX and VIX options yesterday far outstripped moves in the SPX. there's information about market fragility here that we should be mindful of.
the VIX and SPX are negatively correlated. run the regression and it's on the order of -80%. but the slope of the regression (change in VIX per change in the SPX) is time varying. we have periods when the VIX moves a ton relative to the SPX move (Feb'18 volmagedon). in contrast, 2022 brought an extremely dull VIX, muted reactive to moves in the SPX.
yesterday, especially from 12:30 to 1:30pm, both the VIX and $VVIX moved a great deal relative to the move in the SPX. I show this below (thank you, Claude). typical VIX beta (% move in VIX per 1% move in the SPX) has been around 7. yesterday it reached on the order of 50. from 12:30 to 1:30, SPX down just 60bps...VIX up 29% (50x)...
talking my own thinking here, but there is no security in markets better equipped (at a low price) to hedge a near term crash than a short-dated out of the money call option on the VIX. this is what got really bid yesterday. the Oct 25 call (expires Wednesday) went from being worth 6 cents in the morning to more than $1 a few hours later. it exploded not just because the VIX rose so much, but because "vol of vol" surged as well.
no security is more "spot up, vol up" than the VIX itself. it will be interesting to see if this was a one-off or indicative of a larger shift in behavior where investor seek to cover deep left tail risk.


lots of action in $VIX calls today... Oct expiry is Wednesday and you had calls that started the day with basically zero delta and zero premium explode in value.
An example: the VIX Oct 25 call...worth pennies in the morning reached 1.15 (around 1:15pm, coincidentally).
the VIX has been extremely sensitive relative to the move in the SPX... below a table with the top VIX% moves relative to SPX % moves since 2008. Min starting level for the VIX of 15. Today has been significant.
Also - what is going on with all these dates right around 10/15? sounds like a systematic hedging strategy to be implemented!


“Morning, Claude. Write a half page piece on market risk that brings in the Fed being behind the curve, the spillover risk from France, AI circulatory, geopolitical risk, and correlations being too low. Use maximum flourish typically used by an LLM, complete with em dashes and “it’s not this but that”. Make it read as obviously from AI.”
The Quiet Before the Reckoning: Navigating Market Risk in an Age of Complacency
In today's rapidly evolving financial landscape, investors find themselves at a pivotal crossroads—one where the familiar guardrails of the past are giving way to a new and uncertain terrain. Let's delve into the forces shaping this moment.
First, the Fed. It's not that the central bank is wrong—it's that it's late. By the time policymakers acknowledge what the data has been whispering for months, the market will have already moved, leaving a trail of mispriced assets in its wake.
Meanwhile, across the Atlantic, France looms large. This isn't merely a fiscal story—it's a contagion story. Rising OAT spreads are not a local tremor but a seismic signal, one that could ripple through European banks, sovereign curves, and ultimately, global risk appetite.
And then there's AI. The circularity is breathtaking—hyperscalers fund the labs, the labs buy the chips, the chipmakers invest back in the labs. It's not an ecosystem—it's a closed loop. And closed loops, as history reminds us, have a way of unwinding all at once.
Layer in geopolitical risk—a rich tapestry of flashpoints from the Taiwan Strait to the Middle East—and the picture grows more complex still.
Yet perhaps the most striking signal of all? Correlations remain stubbornly, almost eerily, low. This isn't diversification—it's dormancy. When correlations inevitably snap toward one, the illusion of safety will vanish in an instant.
Ultimately, the question isn't whether volatility returns—it's whether investors will be ready when it does. In a world of hidden fragility, preparation isn't optional—it's essential.
I just love anniversaries of all kinds. Dates you look back on and remember where you were and how you felt.
Today is the 50th anniversary - 10/14/76 - of the home run hit by Chris Chambliss in the bottom of the 9th against the Royals to take the Yankees to their first World Series since 1964.
I was 7. He wasn’t Reggie Jackson, but he instantly became my favorite player. Will never forget it.
(They don’t run on the field like that these days!)
youtu.be/gcRRFy_8Gzw?is=Is8h…

Here's the rolling 3m average correlation for the BIG 4...NVDA, AAPL, GOOG, MSFT...the most recent reading is 3.8%. The combined weight of the four stocks has risen dramatically — from ~9% of S&P 500 market cap in early 2015 to ~33% as of September 2026.

What podcasts do you enjoy that best cover the intersection of AI and markets? Looking for recommendations.
Latest podcast features Chris Hentemann, the Founder and CIO of 400 Capital Management.
Launching the firm in the teeth of the GFC, Chris now oversees 8bln in capital, focused on mortgage markets and asset-based credit.
We explore his framework for evaluating complex structures, the role that 400 Capital plays in the SRT market, and why he prefers lending against collateral like turbines versus data centers.
Apple pod:
podcasts.apple.com/us/podcas…
Spotify:
open.spotify.com/episode/5qH…
YouTube Video:
youtu.be/7h7QZEtzm-8?is=vbqp…

and here we thought you should get paid to bear default risk...not suggesting there's some magical "negatively priced option", but this is pretty unique. really a function of risk premium assigned to French sovereign bonds.


The MOVE recorded its highest level since the oil shock reached its maximum impact in late March. Then, the VIX got to 30, double today’s current level. The market’s capacity to absorb higher rates and rate vol has proven impressive.

A pleasure to welcome @ConvexityMaven back to the Alpha Exchange podcast at a time when the MOVE just had its highest close since the height of the oil shock in late March. Always great insights from Harley.
Apple pod:
podcasts.apple.com/us/podcas…
Spotify:
open.spotify.com/episode/6yF…
YouTube Video:
youtube.com/watch?v=8Zii9xl-…
Top 10 stocks... 40% of the SPX and 27 Trillion in market cap. The entire SPX market cap was 27T in late 2019.

A realized vol drought at the index level. Distance from last -2% day is 2.5x normal. The SPX typically realizes more vol on down days than up days, except recently. On down days, just 7.4% over the last month. On up days, 13.2%.


