

Building automated trading systems. Forged in the open. Proof over promises.
Joined August 2022
- Tweets256
- Following19
- Followers45
- Likes328




Pinned Tweet
Most trading bots are lying to you.
Not on purpose , the person selling it usually believes the numbers. They just never checked if their backtest was cheating.
7 months. 90+ strategies. Most died in testing.
The hard part isn't building something profitable. It's proving you didn't fool yourself.
That's this account. The research, the failures, the proof.
No signals. No guarantees. Nothing I can't defend.
before my bot placed a single live trade i wrote a document
what i expect it to do
what result would make me keep it
what result would make me kill it
and the date i am allowed to look
i am not allowed to read the win rate until 50 trades
easy to write before money is on the line
very hard to write after
spent a week confused about why my backtest and my live account disagreed
mt5 candles are bid prices
but when you close a short you buy at the ask
so every short in my backtest was stopping out slightly later than it really would
this is the third separate place the same assumption has been hiding in my code
buy limits in october
sell limits two days after that
and now short exits
the market was fine every time
what kept being wrong was my idea of which price the broker was using
four days ago i posted that my backtest was measuring a bot i do not own
it moved stops twelve times an hour
mine moved them once
that gap was worth almost four points of win rate and i had to bring a published number down because of it
so i made the bot faster
it now checks every five minutes
same strategy
same entries
same stops
it just looks more often
a trade would go into profit and come back and the old bot would find out 55 minutes later
the backtest was never wrong about what was possible
it was wrong about what i had built
so i went and built the thing it was describing

simple version of how my bot protects a trade
entry 100
stop 90
so 1R is 10
once price hits 110 the stop starts following
it sits 0 75 ATR behind the best price seen
price 115, stop 109
price 120, stop 114
price falls back to 116, stop stays 114
it only moves one way
it never retreats
once the stop is above 100 the worst outcome left is a win instead of a loss
the one case where that is not true is a gap straight through the level

Last week I lost five trades in two hours and went looking for the problem
I found the wrong one
So I went back and asked what my worst declines actually look like
The deepest single day in 36 months took 2.86% off
That is the most a bad day has ever cost me
Every decline past 4% took between one and three weeks to get there
Not one of them happened in a session
The worst was 27 days
25 trades
2 winners
Fourteen losses in a row inside it
Which means the thing that scared me is not the thing that hurts me
A bad hour is loud and it ends
The expensive ones are quiet and they take a month and every single day of it looks survivable on its own
I had been building protection against the version I could feel

Comparing portfolios at the same risk per trade hides the entire reason you built one
I ran every combination of my three instruments at a fixed 0.50% and the ranking came out muddled
Bigger portfolios looked worse on drawdown and better on return and nothing lined up
The reason is mechanical
More instruments means more positions open at once which means a deeper drawdown
So at a fixed risk setting you have held constant the exact thing diversification is supposed to buy you
So I did it the other way
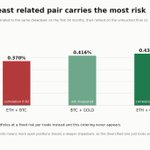
Calibrate each pair to the same drawdown on the first 24 months then rank on the untouched final 12
The answer fell straight out
My two most correlated instruments carry the least risk
My least correlated pair carries the most
Perfect ordering by correlation
Same data both times
The only thing that changed was which variable I held still

I read a framework this week with nine numbered equations in it
Every one of them was a definition
Not one number in the whole document could have come out differently
That is the thing notation does to you
It makes a checklist look like a finding
and a finding is something that had a chance to be wrong
I opened an account this week to test one change
Before it placed a single trade I wrote down the date I am allowed to look at the results
The whole file is the exact config
Five conditions it has to meet to be kept
Five that switch it off
And the gate
50 trades
Checked once
Not before
The 50 is the part worth explaining
At 20 trades a process that wins 70% of the time prints anywhere from 55% to 85%
That is not a small amount of noise
That is most of the range I would be trying to tell apart
So if I look at week three and see 60% I kill something that works
If I see 85% I post it and people believe me and I look ridiculous in month three when it settles back to 70%
Both of those are the same mistake
Looking early does not give me a weak answer
It gives me a confident wrong one
The second half is the part nobody says out loud
Everyone will tell you not to abandon a strategy too early
Almost nobody admits an early good result is just as worthless
By then they have already told you about it
I do not know yet whether this change is any good
I have made it so I cannot find out until the answer means something
Risking less per trade made my risk control worse
That is backwards from how everyone talks about position sizing and it is only arithmetic
I measured what my bot actually risked against what I told it to risk
Three instruments
5,000 account
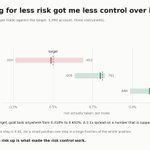
At a 1.00% target it landed between 0.888% and 1.020%
Tight
At 0.75% it landed between 0.609% and 0.761%
Still tight
At 0.50% gold ranged from 0.310% to 0.652%
A 2.1x spread on a number that is meant to be a constant
The reason is the lot step
My broker trades gold in steps of 0.01 and nothing smaller
At 1% the position is big enough that one step barely moves it
At 0.50% the position is small enough that one step is a large piece of the whole thing
So the risk can only land on a coarse grid and the grid does not line up with what I asked for
Which means cut your risk per trade has a floor
Below a certain size you are not risking less
You are risking somewhere between half and a third more than you intended and you do not get to pick which
Everyone says reduce risk to stay safe
Nobody mentions that reducing it past a point is how you lose the ability to set it at all

I published a 73.87% win rate. The right number is 70.07%. Here’s the mistake, because it’s a subtler one than my last few.
I’d been treating finer data as straightforwardly better. More resolution, more accuracy. So when I re ran everything at 5 minute bars I took that number as the honest one.
It isn’t, and the reason is that two different things were hiding behind one setting.
How often the stop gets checked is a question about whether my backtest is lying to me. My broker watches the level tick by tick, and an hourly backtest that tests the bar’s full high and low against the stop is already doing the same job. Those agree.
How often the stop gets moved is a question about what my bot is physically able to do. It runs once an hour. It can move a stop once an hour. The 5 minute backtest moves it twelve times.
So the 5 minute run wasn’t a more accurate picture of my bot. It was an accurate picture of a different, faster bot that I don’t own.
The entire 3.8 point gap comes from one population: 0.18% of hourly moves that reach +1R and fall back to the original stop within the same hour. A faster bot locks part of that in. Mine watches it go.
One number was answering two questions and I never noticed it was doing both.
It cost five weeks. At 73.9%, fifty live trades would have been enough to separate the result from 60%. At 70.07% it takes seventy five.

A trailing stop configuration in my grid looked better than what I’m running. Before I trusted it, I re scored every configuration three times, on hourly bars, then 15 minute, then 5 minute. Nothing changes except how finely the path between entry and exit is sampled.
The control is a fixed stop that never moves. It can’t care how big the bars are, so whatever it drifts by is pure measurement noise. From 15 minute to 5 minute it moved by zero.
That zero is what makes the rest of the column readable. Everything else that moved, moved for a reason.
The configuration I was interested in lost 93.8 points going to 15 minute, then another 82.0 going to 5 minute. Still ahead of the control at that point, by 81.9.
Read those two numbers next to each other. The lead it had left was smaller than the correction it had just taken. One more step down in resolution and there’s no reason to think it survives.
So it isn’t converged, which means it isn’t a result. It’s a number that happens to be where the measurement stopped.
The rule I’m keeping: a path dependent result is only worth trusting once it stops changing when you look closer. If it’s still moving, you haven’t measured it, you’ve just stopped looking.

I scanned about 17k paid expert advisors for sale on the MT5 marketplace to see what I’m competing with. Median price 399 dollars, one time, no subscription.
57% link a live signal. 40% use some form of scarcity, a countdown, a price about to rise, a limited number of copies. 26% advertise that they don’t use grid or martingale, which tells you what most of the rest are doing. 16% lead with AI.
The part I keep coming back to is the drawdowns. Vendors publish 42%, 56%, 78% as selling points. Not hidden in a footnote. In the listing, as evidence of performance.
One of them shows a gain of −99.9% and a drawdown of 99.98%. The account lost essentially everything. It is still for sale, today, at 365 dollars.
I’d assumed the problem in this market was that bad numbers get hidden. It isn’t. They’re published and they still sell.
Which reframes the thing I’m trying to do here. Being honest about my numbers isn’t a differentiator if nobody is checking. The differentiator has to be that the numbers themselves survive someone checking.

I found a change that cuts my worst drawdown from 8.65% to 2.66%. I haven’t shipped it, and I’m not going to yet.
Trailing stops. I tested 24 configurations against the same entries. Every single one reduced the maximum drawdown. Not most of them. All 24.
It isn’t a fluke either, it has a mechanism I can point at: 21.8% of the trades that reach +2R give the whole thing back and stop out at −1R. More than a fifth of my good trades turn into losers in front of me. A trailing stop keeps part of that.
So why is it still sitting there.
Because every one of the 24 fails my expectancy gate. The rule I set before running any of this was that a change has to beat the current setup in both the 24 month window and the 12-month one. Fixed wins the first. Trailing wins the second. That isn’t a result, it’s a coin landing on its side.
Which leaves me with a change that makes the number people are most afraid of look dramatically better, and leaves the number that actually matters undecided.
The temptation is obvious. Drawdown is the number that sells. If I shipped this I could show a 2.66% worst case and nobody would ever ask which window it won in.
The gate was set before I knew the answer. Nothing about liking the answer changes whether it passed.
This one is unfinished. I’ll post the resolution whichever way it goes.

My own sales material tells people to expect a losing streak of six or seven trades. I went and measured it. The real number is fourteen.
Nobody has bought this yet, so I’m correcting it before it costs anyone anything rather than after.
Here’s why the gap matters more than it looks. Someone who’s been told to expect six or seven starts getting uncomfortable at eight. By nine they’re convinced it’s broken. At eleven they turn it off and ask for a refund and at every point in that sequence the bot is doing exactly what it was built to do. The number in the manual decides when a working system gets switched off.
The real figure comes out of my worst drawdown: 27 days, 25 trades, 2 winners, 14 losses in a row. All three instruments losing at once, including gold, which correlates 0.15 with the other two. Low correlation is not independence. It just means they don’t usually lose together.
Six or seven wasn’t measured. It was a guess that sounded reasonable, written down, and then quoted back by me as if it were a finding.
Fourteen is what the data says. If I’d shipped first and measured second, the first person to hit eleven would have found this out instead of me.

I lost five trades in two hours this morning. All five were sells, across three instruments.
My own notes said this could happen. Five positions at 0.5% each isn’t five small bets, it’s one 2.5% directional bet, and two of those instruments correlate at 0.82, so some of the diversification I think I’m buying isn’t there. The note put the cost at 2.5%. It cost 2.32%.
So the obvious fix is to cap how many positions can face the same way. I wrote the prediction down before running it: drawdown falls, trade count falls, and the question is whether the first pays for the second.
It doesn’t fall. Flat at a cap of 4, flat at 3. At 2 it gets worse, bad enough to trip my own 9% breaker and costs 271 points of three year return.
So the thing that hurt this morning is not the thing that produces my worst drawdowns. Remove those clusters entirely and the number doesn’t move. The deep ones must come from losing runs spread across days, not one concentrated hour.
I found the right event and the wrong cause, four hours after it happened.
Second time this week a loss handed me an instinct and the test said no.

My bot asked for 0.0999 lots. The broker trades in steps of 0.01. So it rounded down to 0.09 and risked 0.45% instead of the 0.50% I told it to.
That’s a rounding error, and rounding down is the safe direction. But the size of it is the part worth looking at.
On BTC with a 5000 account, one lot step is about 11% of a whole position. There is no way to express 0.50% risk more precisely than that. The number I set and the number the broker executes are simply different, and the gap isn’t a bug I can fix.
Now scale it. On a large account a position is hundreds of steps, so the rounding is noise. On a small one it’s a tenth of the position. Same rule, same code, completely different consequence depending on how much money is in the account.
This is the mirror image of something I found in the pricing work. On accounts too small for the instrument, one minimum lot already exceeds the intended risk, so the floor stops protecting you and starts over risking you instead. The backtest returns go up as the account shrinks, which looks like an argument for small accounts and is actually the tell that something is wrong.
Rounding down is safe right up until the minimum size is bigger than your risk budget. Then the same line of code quietly does the opposite of its job.
The number I trust least is the one from my best instrument.
I searched 738 parameter combinations on ETH and kept the best one. Then I ran that same configuration against 1000 random entry versions of itself. Same risk, same exits, same instrument, entries replaced by a coin flip. None of the 1000 beat it. 7.4 standard deviations above the random mean.
That number is partly real and partly the search. I went looking for the best combination, so of course it looks good on the data I went looking in.
So I took those parameters, untouched, and pointed them at BTC and gold. No tuning, no second search, nothing fitted to either. BTC came out at 7.9σ. Gold at 5.5σ. Zero of 1,000 on both.
Those two carry no discount. There was no search to discount.
Gold is the one I’d point at if only one number could carry the argument. It correlates 0.15 with ETH, so it isn’t the same trade wearing a different name, and it works anyway.
What it doesn’t say: 93 of the 1,000 gold nulls rode a smaller drawdown than the real strategy. The edge is real, the risk profile isn’t special. And gold on its own breaches my 9% drawdown limit, so it isn’t a product by itself.

My project doc warns, in writing, against claiming anything I haven’t verified.
On Monday I wrote into that same doc that every figure in an entire section was stale and needed re running. I hadn’t opened the script. Half of it had been computed correctly all along.
My own documentation made an unverified claim about itself, inside an hour of telling me not to.
I tested two new instruments and I was wrong twice getting there.
First wrong call: I expected FX to suit this strategy because the spreads are tiny. They are. So are the moves. What matters isn’t spread, it’s spread as a fraction of the stop, and on that measure EURUSD is the worst of the five instruments I’ve tested. Gold is the best.
Second wrong call: at +0.227R across 183 trades I said on record that I expected neither to clear its null. Both did. Only 2 of 1000 random entry runs beat EURUSD on expectancy, 9 of 1000 on GBPJPY.
And then the finding that actually matters. On drawdown, 699 of those 1000 random runs had a better ride than EURUSD. 831 of 1000 on GBPJPY.
The entry logic picks better trades than chance and arranges them into a worse ride than chance. Seven in ten coin flips were less painful to sit through.
Beating random on expectancy and losing to random on drawdown is a combination I didn’t have a name for. It isn’t an edge I can sell.
