

Chanel: https://xitter.cf/t.co/rVnrggeSBi Business Contact: https://xitter.cf/t.co/lmrKmHHTVy
Twitter
Joined September 2022
- Tweets6.8K
- Following1.2K
- Followers23.1K
- Likes13.3K


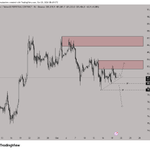
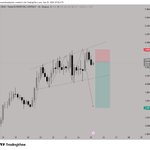
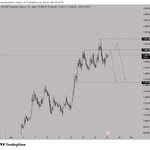



#ETH Update
🔴MOVE SL Entry


#ETH PLAN
Scenario 1: Recovery from Support
Price holds the current support zone ($2,313–$2,393) and pushes upward to retest the upper resistance area around $2,577.
Scenario 2: Continuation of Downtrend / Deep Liquidity Sweep
If heavy selling pressure completely breaks through the current support zone, the price risks a sharp decline with a target around the $2,095 region.
⚠️ Note:
All shared information represents a personal perspective based on Technical Analysis (TA).
Not financial or trading advice.

#BTC Update ✅
➡️ BTC followed Scenario 1 and tested the 83k–83.4k zone. If this resistance zone is broken, BTC will continue to push toward the 84.7k–85k region.

#BTC PLAN (Oct 20)
Scenario 1: Bullish Scenario
Price consolidates sideways in the $80,600–$81,600 range to build support (SP), continuing the upward move toward $83,000–$83,800.
Scenario 2: Bearish Scenario
If the price fails to hold key support levels (especially the ascending trendline connecting from the $79,726 low and the $80,632 mark), selling pressure will increase significantly.
The price is likely to drop toward the $77,000 region.
⚠️ Note:
All shared information represents a personal perspective based on Technical Analysis (TA).
Not financial or trading advice.

#ETH PLAN
Scenario 1: Recovery from Support
Price holds the current support zone ($2,313–$2,393) and pushes upward to retest the upper resistance area around $2,577.
Scenario 2: Continuation of Downtrend / Deep Liquidity Sweep
If heavy selling pressure completely breaks through the current support zone, the price risks a sharp decline with a target around the $2,095 region.
⚠️ Note:
All shared information represents a personal perspective based on Technical Analysis (TA).
Not financial or trading advice.
#BTC PLAN (Oct 20)
Scenario 1: Bullish Scenario
Price consolidates sideways in the $80,600–$81,600 range to build support (SP), continuing the upward move toward $83,000–$83,800.
Scenario 2: Bearish Scenario
If the price fails to hold key support levels (especially the ascending trendline connecting from the $79,726 low and the $80,632 mark), selling pressure will increase significantly.
The price is likely to drop toward the $77,000 region.
⚠️ Note:
All shared information represents a personal perspective based on Technical Analysis (TA).
Not financial or trading advice.


🔴#BTC CME Chart Analysis
⚫️Pattern: Broadening Wedge / Megaphone Pattern
1. Market Structure & Technical Context
Primary Trend: After a sharp drop from the peak to the low (June–July), BTC consolidated around $60,000 before a strong impulsive move broke the downtrend.
Current Pattern: Price is moving inside a Broadening Wedge (Megaphone Pattern), characterized by expanding volatility with higher highs and lower lows.
Current Position: Price has just printed a strong bullish candle, breaking above the upper boundary of the wedge.
Scenario 1: Bullish Breakout & Re-test
Outlook: Price confirms a breakout above the upper boundary. A re-test of the dashed line at $79,785 (new support) is expected.
Confirmation:
Daily candle closes completely above the wedge boundary.
Strong buying pressure or lower wick rejection appears upon re-testing $79,785.
Scenario 2: Bull Trap / Fakeout
Outlook: Broadening wedges carry a high risk of fakeouts. Without volume confirmation, profit-taking could quickly pull the price back inside the wedge.
Confirmation:
Daily candle closes back below $79,785 with a strong bearish dump.

🔥PLAN #BTC UPDATE
BTC broke out of 77,700 and is retesting the previous high.
Key Bullish Level: 77,500 – 77,700
Scenario 1: Breakout above 82,000 – 82,400
Action: Strong buying pressure pushes a solid 4H candle close above the pink supply zone (82,000 – 82,400).
Price Action (PA): Liquidity cleared, triggering a direct continuation upward. Expect a quick retest around 82,000 (flipping resistance to support) before pushing higher.
Scenario 2: Rejection at 82,000 – 82,400
BTC pulls back to the 79,100 support level.
Case A (79,100 holds): Sell volume exhausts at 79,100. Buyers step back in to build momentum for another attempt to break 82,000 – 83,000.
Case B (79,100 breaks → Retest 77,500):
If 77,500 holds: A bullish recovery structure forms. This offers the best Long entry with an optimal R:R ratio to target the 82,000+ breakout.
If 77,500 breaks: The bullish structure invalidates, confirming the recent rally was a bull trap/retest. Price enters a new downtrend.

bitcoin:native has followed the first scenario, breaking out of the 82,000 – 82,400 zone.
Inside the chart, the prices are Fibonacci levels acting as pivot points.


🔥PLAN #BTC UPDATE
BTC broke out of 77,700 and is retesting the previous high.
Key Bullish Level: 77,500 – 77,700
Scenario 1: Breakout above 82,000 – 82,400
Action: Strong buying pressure pushes a solid 4H candle close above the pink supply zone (82,000 – 82,400).
Price Action (PA): Liquidity cleared, triggering a direct continuation upward. Expect a quick retest around 82,000 (flipping resistance to support) before pushing higher.
Scenario 2: Rejection at 82,000 – 82,400
BTC pulls back to the 79,100 support level.
Case A (79,100 holds): Sell volume exhausts at 79,100. Buyers step back in to build momentum for another attempt to break 82,000 – 83,000.
Case B (79,100 breaks → Retest 77,500):
If 77,500 holds: A bullish recovery structure forms. This offers the best Long entry with an optimal R:R ratio to target the 82,000+ breakout.
If 77,500 breaks: The bullish structure invalidates, confirming the recent rally was a bull trap/retest. Price enters a new downtrend.


🟢If BTC breaks above 82,400 in the next few days and completes a double bottom pattern, it will likely retest the weekly resistance around 90,000 – 92,000.

