




Addy retweeted

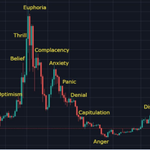
THIS CHART HAS NEVER LIED
We are NO LONGER WAITING.
The setup is 100% COMPLETE.
The line held.
The turn is in.
This is the moment I waited years for.
From here, the move won’t be normal.
This is where price EXPANDS, NOT GRINDS.
This remains the ONLY CHART YOU NEED TO TRUST.
And it has played out EXACTLY AS PREDICTED.
No more warnings.
No more patience.
The next few days and weeks will be EXTREMELY volatile.
Don’t worry, I’ve been in this game for more than 10 years, and I’ve been through worse. I’ll keep you updated on everything.
Turn on notifications so you don’t miss any important updates.
A lot of people will wish they followed me sooner.
Addy retweeted

These posts are still living rent free in my head.
They called October 6th with 100% accuracy.
They also called QE coming back under a new label.
Now the Fed is expanding again… purchases of short duration T-Bills just hit $381B.
Almost $60B above the height of the 2020 REPO bank crisis "virus".
The post predicts:
BTC → $190,000
ETH → $15,000
SOL → $1,000
Then by similar multiples:
XRP → $8–$12
HBAR → $0.80–$1.20
LINK → $150–$250
XLM → $1.50–$2.50
Same structure.
Same setup.
The simulation looks like its about to run it back...


Could you unmute my account on Telegram for $MUBI @that1guypablo May have been some accident.
261
Addy retweeted

#Altcoin Dominance is giving momentum signals shift that haven't been seen since 2020
Outperformance in the past has lasted multiple years:


Addy retweeted
Making long term conclusions on #Crypto due to the performance since 2022 is doing so in the same conditions as 2018 to mid-2020 in which BTC was down 50%, ETH was down 75%, Alts were down 90%
Almost everything across the board is sitting in 2020 as shown below 👇





Addy retweeted
The #Crypto Market is giving everyone the second chance at summer 2020 right now yet just like back then interest in Crypto is at rock bottom
Just like back then ETH is down over 50% from all time highs
Just like back then Alts were mostly down 80%-95% down from all time highs
Just like back then the DXY (US Dollar) is sitting close to 96
Just like back then ISM Manufacturing PMI is reaching 52.6
Just like back then Gold was going for its parabolic top
Just like back then Silver was going for its parabolic top
Just like back then BTC Dominance was sitting at 60%
Just like back then ETHBTC was sitting at .03
Just like back then Alt Dominance (chart below) was sitting at .12%
Just like back then Russell/S&P was showing a reversal after a multi -year downtrend
Just like back then Russell/NASDAQ was showing a reversal after a multi-year downtrend
Just like back then Copper/Gold was finding a bottom after a multi-year downtrend
"This time is different......"
Probably not
Leaving this data here and you can decide accordingly 🖐️
Addy retweeted

A major shift is underway.
And when we line up GOLD, Bitcoin and PMI, we can see what is happening.
So many people recently on here have been parrotting "GOLD does not rotate into Bitcoin"... and more recently "ISM is the new M2"
And the funniest thing is that its not even about whether actual profits from Gold literally go into Bitcoin.
It is more about the actual rotation and shift of the market direction based on the overall global foundation.
And when you look at this chart you simply cannot refuse to see that the market rotates from GOLD to Bitcoin... it is undeniable.
And ISM, like any metric, holds a lot of weight by itself still, but even more when referenced like this.
Here is what I believe to be true and what it signals.
Gold performs well in uncertain economic and geopolitical times.
So it makes total sense that we can see here, GOLD performs well when PMI(the economy) is in contraction(below 50), as contractions create uncertainty and investors seek to protect themselves in GOLD.
As the economy begins to pick back up and expand, certainty begins to return and investors become more confident in holding other assets and taking more risk, leading to GOLD topping out.
And this chart makes that very clear as GOLD, throughout the previous two cycles, has topped give or take one month from PMI pushing back over 52 into nice expansion.
It's not a coincidence.
From here, as the economy keeps expanding, investors continue to become more comfortable taking risk and we see Bitcoin now has its turn.
It doesn't get clearer than this in my view.
This right here is 3 fundamental investing pillars that combined, tell a very clear risk on/risk off story.
But here's the sticking part of what we have just been through...
The single biggest thing that has confused everyone this cycle and made them think that $126k was the top, is that Bitcoin has actually made new highs during PMI contraction and GOLD running, for the first time ever.
And that is because ETFs, Saylor and government adoption have pushed Bitcoin higher in a uncertain and low liq environment.
Which is the main reason this cycle we did not have any level of parabolic move, almost no alts made new highs, and zero top signals came close.
$126k was a mid cycle top within an extended cycle due to record breaking liquidity/economic contraction, that is now only just shifting into the conditions crypto thrives in.
I hate this saying... but i dont make the rules, lol.
This is an objective chart that i have just annotated with times and info.
But even without them, a young child could see the correlations here between them all.

Addy retweeted
I would not ignore this.
There are rumblings that the ISM data being released tomorrow is going to come in above 50, with some estimates even over 51.
If that happens, it is very significant.
Here we have:
- Bitcoin
- Copper/Gold
- ISM/PMI
For those who are unaware, the ISM reading is essentially whether the economy is in contraction or expansion based on manufacturing. A reading of under 50 is contraction, and over 50 is expansion.
You can see here very clearly, every single time since Bitcoins inception, when ISM has pushed back towards the 52 level after being in contraction(under 50), it has marked that:
1. The Bottom is in for COPPER/GOLD
2. Bitcoin has begun its true expansion phase
You will notice that the PMI reading has been in by far its longest contraction ever, and this is a key piece of data that explains why this bull cycle has been so different.
It is the first time ever that Bitcoin has made new highs whilst the PMI has been in contraction.
It explains why this bull cycle has been so weak because the foundational state of the economy/liquidity has not been there to support it.
Its not a coincidence, by any means.
In addition, this is all happening as GOLD has very likely finished its mega run, meaning COPPER/GOLD is very likely bottomed, with COPPER pushing, in line with high manufacturing and development business happening...
Contributing towards the increasing PMI.
Just as Bitcoin is approaching its invalidation levels for HTF structure break, and almost everyone has now succumb to a year long bear market.
All of this is linked together and telling us the same story.
If PMI comes in close to 52 tomorrow, I expect this to be a market shock and begin the reversal phase throughout Feb.
This is data that truly matters.


Addy retweeted

The 4chan guy who called the two last exact bitcoin bottoms and tops has just made a new prediction for 2026
Will he be right once again?


