
Consultant Radiologist | MRCS FRCR | Thoracic & acute | #MedEd | Memes and MIPs | Nodule detector 🔎
- Tweets3.1K
- Following1.3K
- Followers549
- Likes7K








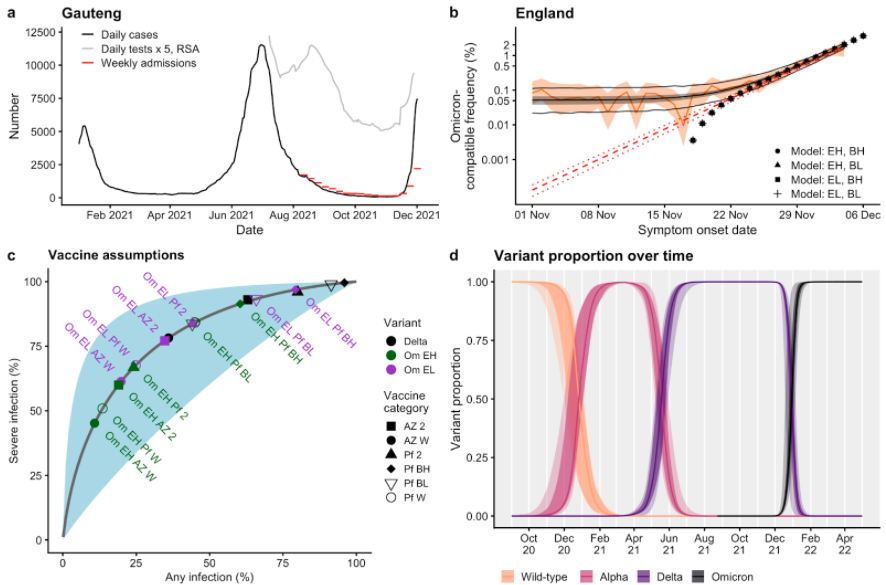
ALT Figure 1 from the paper linked in the tweet. This figure has four panels: a, b, c, and d. Panel a shows a time series of daily cases and weekly hospital admissions for Gauteng province in South Africa, as well as 5 times the number of daily tests in South Africa overall, between February and December 2021. Panel b shows the proportion of symptomatic Pillar 2 cases with S gene target failure data in England between 1st November and 6th December in orange, with statistical fits to this data and the proportion of Omicron shown in black and red, as well as transmission model fits showing the proportion of Omicron over time (black points). Panel c shows vaccine effectiveness assumptions for Delta and Omicron variants, for low and high immune escape scenarios for Omicron, for different vaccine products, and for different levels of protection (second doses, waned, boosted high and boosted low). Panel d shows the modelled proportion of variants over time: Wild-type, Alpha, Delta and Omicron.


ALT Image of a graph showing cost savings from investing in clinical radiology and clinical oncology trainees. Investment in trainees could save the NHS £420 million by 2030.