

Edited by Eileen G Ernenwein and Gregory Tsokas, Archaeological Prospection is journal featuring articles on nondestructive archaeological exploration.
- Tweets131
- Following36
- Followers214
- Likes28





ALT Archaeological Prospection: Volume 31, Issue 4 Pages: 291-428 October/December 2024

ALT Comparisons between magnetic (top) and GPR results (bottom) for P1, P2, P6, P7, P23 and P26 at Grid A1.

ALT Cross correlation of archaeological and geophysical results: (a) the excavated remains illustrated using Autodesk AutoCAD—the red dotted lines represent the borders of high-resistivity anomalies; (b) magnetic gradient map—the red circles are the corners of the excavated area; (c) the 0.5–1.0 resistivity depth slice map—the black dotted lines outline the detected features; (d) photograph of the final architectural elements of the excavated archaeological area—here, the white dotted lines represent the borders of mud-brick walls.

ALT Results of identifying three classes of Aqueduct, Citadel and City wall in the city of Zuzan using deep learning (This image is test data and has not been labelled before).

ALT (a) Orthophotography, (b) DTM, (c) slam RS10 point cloud.

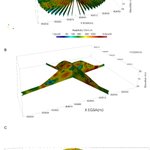
ALT (A) Overview of the 3D inversion results, sliced along each radial profile. (B) Details of the two profiles, one that intersects the found tomb and one at 90°. (C) 2D plane view of the profile that interests the tumulli.

ALT Inversion results of the measured (a) and pole–pole converted 3D dipole–dipole data set (b) and the relative difference between the two results (c). Five depth slices between z = 55.8 m and z = 57 m are plotted as a 3D view. Additionally, one representative depth slice at z = 56.7 m is shown as 2D plot for each inversion model.

ALT Detailed maps of the Saliège (Data—C. Tomczyk, J. Bemon; GIS—N. Minvielle Larousse).

ALT Pottery density (left) and estimated pottery density weighted according to the inverse of visibility (centre) of the Hellenistic−Late Roman Period (350 bc–650 ad). The difference (right) was computed according to a Jenks classification (Figure S6). Map projection: WGS 84/UTM zone 34N, north-oriented, units of measure in kilometres (EPSG: 32634).

ALT Comparison of FWI and reflection seismic section (a), ERT (b) and EMI (C) results of profile P-M with archaeological records (d, Höfer 1902). Relevant details of the reflection seismic section (e). Labels A–D mark location of known excavated structures. Red boxes in the seismic results (a, e) illustrate positions of excessive hardness according to DynP.

ALT Comparison of the handheld thermal imagery in different field constructions at different times of day. The heat map gradients are relative for time of capture, with red being warmest and purple being coolest. Gravels and cobbles retained heat into the evening. Gravels also retained heat and increased surface temperature more-so than cobbles or areas absent of gravel.

ALT Vertical and horizontal cross-sections showing the Vp in the interior of the tumulus. On the top of the s of the mound a highly localized high velocity anomaly corresponds to a modern, human-made concrete rectangular column, which can be seen in the inset picture (taken on the 21 October 2009). This structure also annotated with the arrow, depicts a triangulation pillar of the Hellenic Military Geographical Service, aka permanent reference point, used for geodetic purpose. The background image used for the representation is the same satellite image used in Figure 2, obtained from Google Earth.

ALT Digital validation in England. The red points represent the Atlas of Hillforts of Britain and Ireland dataset, and the blue polygons represent the generated inferences. The first line illustrates two hillforts that were not detected out of four, as they were not visible in the LRM or the orthoimage. The second line illustrates a potential true positive on the left and a false positive on the right. The third line illustrates a true positive and two potential true positives. The fourth line illustrates four true positives.

ALT Comparison between different views of the Marianelli Area 3 dataset: (a) drone-based photogrammetric orthophoto, showing Marianelli's rugged terrain and its dense vegetation coverage, (b) DTM where cooler colours indicate higher elevation, (c) its hillshade visualization generated with an azimuth value of 315° and an elevation angle of the artificial sun of 45°, showing enhanced image sharpness, and (d) modified LRM visualization, where lighter tones represent less pronounced slopes and darker tones represent steeper slopes. The latter view emphasizes details of slopes in false colours.

ALT (a) ERT profile P1 with exterior DEM and (b) with interior DEM; (e) ERT profile P2 with exterior DEM and (f) with interior DEM. The black frame shows a raised bed in relation to the Santonian limestone level on which the north and south apses were built. In figures (c) and (g), the close-ups highlight the position of these foundations directly in line with the arches of the interior DEM. Overall views (d) and (h) show the general foundations of the chapel on the Santonian limestone.

ALT Seismic profile over lines 20230809172202 (top) and 202308091615021 (centre) showing a lack of discernible seismic anomalies detected near Survey Areas 99-12 (top) and 99-15. One seismic anomaly can be observed in proximity to Survey Area 99-14 (top). All three archaeological sites were documented in the 1990s.

ALT Kernel density. Kernel density of (a) post-medieval and (b) prehistoric agro-pastoral landscape (‘X’ marks archaeological sites—from left Grmača hillfort, Ambrož hillfort, Cerkvence—‘O’ marks post-medieval villages—from left Kostanjevica, Temnica, Lipa—and dashed line marks the path of the profile); (c) profile of kernel density (orange for post-medieval and green for prehistoric agro-pastoral landscape).

ALT Areas of identified occupation in the lower town of Türkmen-Karahöyük based on the magnetometry survey data.

ALT Combined August 2022 and May 2023 Geoplot-processed data overlayed on existing Fluxgate Gradiometer data, with previously mapped features overlayed demonstrating alignment of the anomalies in the gamma radiation data with known features. Overlayed data include the Antiquaries Great Plan (pink lines), the Fluxgate Gradiometer interpretation of the roads (black outlines), positive linear features in the Fluxgate Gradiometer data (blue lines) and historic field boundary from 1759 (red dotted line).