


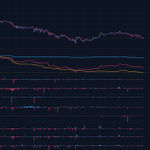


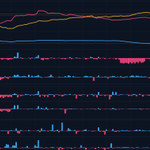
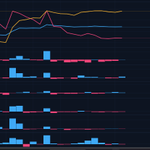
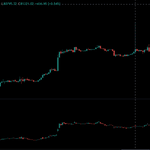



przy tej ostatniej podbitce OI mocno wrosło nie spadło więc shortów raczej mamy mało już wypłukało więcej shortów teraz przy lekkim spadku ceny OI stabilnie więc raczej korekta jest blisko bo popyt spot słabnie

30
Fajna ciekawa strona pokazuje iflu na x i ich live call i skuteczność pamiętaj ufaj tylko sobie nikt nie wie co się wydarzy :) jak widac na scrennie skuteczność mniejsza lub większa ;) top około 60% więc cudów nie ma :)

35


Mally_trader retweeted

New issue of my weekly newsletter is up.
Bitcoin bounced back to the 62K-64K range this week, but the on-chain data tells a more cautious story: dominance flat, short-term holders still underwater, futures demand leading while spot lags.
Full breakdown of cost basis levels, ETF flows, and the Coinbase premium in this week's report. ⤵️


Jak to widzę teraz aktualnie nałapią nowych shortów 65500-65200 ważne wsparcie trochę potrzyma na tych poziomach żeby nałapać jeszcze więcej shortujących i wybicie w góre ;) widzę sentyment za mocny na spadki, a ciężej z niższych poziomów złapać soczyste likwidacje z góry ;)
66
Mally_trader retweeted
Updated dashboard drop. One screen, everything that matters for $BTC trading decisions.
📊 What it tracks:
- BTC price (CryptoQuant data, real-time)
- Realized Price - where the average coin last moved
- NUPL - how deep in profit/loss the market sits
- Coinbase Premium Gap - US spot demand vs discount
- Exchange Reserves - coins moving on/off exchanges
- Funding Rate - longs or shorts leaning too hard
- Open Interest - size of the leverage stack
- MVRV - holder profitability vs historical baseline
- Fear & Greed - crowd sentiment vs price reality
One view. Trend, liquidity, leverage, sentiment - all in one place.
Free. No login. No paywall. Just the data.
I use this live for my analysis. Now you can follow the same data in real time.
btc-analysis.com/#dashboard


Mally_trader retweeted

The math here tells a different story than the headline.
Strategy holds 714,644 BTC. At $8,000, that’s $5.7 billion. Their convertible debt alone is $8.2 billion. Add $7.5 billion in preferred stock obligations and you’re looking at $15.7 billion in total liabilities against $5.7 billion in assets. That’s 36 cents on the dollar.
The claim technically works only if you strip out preferred equity entirely and assume their software business (which generated $123M in quarterly revenue) somehow fills the gap. At $8K BTC, the software business would need to be valued at $2.5B+ to make the math work. That’s a 20x revenue multiple for an enterprise analytics company that hasn’t grown meaningfully in a decade.
BTC went as low as $60,062 last week. A 52% drop from the October peak of $126,080. Strategy’s stock fell 49% and their average cost basis is $76,056 per coin. They’re already underwater at current prices.
The $8K number is a distraction. Pick a number so absurd nobody stress tests the range between here and there, where the real pain lives.


Mally_trader retweeted

Prawie skończyłem robić update do aggr, o który prosiliście i jutro go udostępnię. Pomóżcie dobić do 8k follow to wrzucę jeszcze heatmape z opcją stworzenia zagregowanego OB wszystkich najważniejszych giełd SPOT oraz FUTS w dodatku wyróżniającą się sporą możliwością konfiguracji, która również jest darmowa.

What day of the week is it easiest to manipulate the #crypto market? Ofcourse that it is Sunday,). Who knows whose positions were leveraged x50...?
1
87