

Crypto Goon 🥷| No fluff, no shortcuts just facts | 0x53
Gutter 🌑
Joined June 2024
- Tweets2.1K
- Following399
- Followers463
- Likes41.6K


Pinned Tweet
$BTC / $ALTCOINS
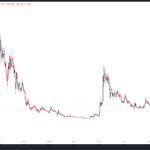
l 2018 - 2020 l Accumilation phase / Market structure
The main reason the market feels so uncertain right now is actually quite simple:
Bitcoin already broke above its previous all-time high, while a large part of the broader crypto market failed to follow.
Historically, when BTC breaks into price discovery, capital eventually flows throughout the rest of the market and a broader bull cycle begins.
This time, the process has been very different.
As a result, many investors quickly concluded that altcoins are dead.
In my view, that conclusion is premature.
What changed this cycle is the introduction of spot Bitcoin ETFs.
For the first time in crypto history, institutions gained access to Bitcoin through a regulated and familiar investment vehicle, allowing large amounts of capital to enter BTC without requiring exposure to the broader crypto market.
This created a dynamic that we have never seen before.
Bitcoin was able to attract significant institutional demand while much of the altcoin market remained stuck in a prolonged accumulation phase.
You could describe this as a Bitcoin-led cycle rather than the broad market participation typically seen in previous bull runs.
If anything, it may simply mean that the cycle is unfolding in stages.
First came institutional accumulation through Bitcoin.
Later may come the return of speculation, risk-taking, and broader participation across the crypto market.
That is one of the main reasons why I continue to believe this accumulation phase could persist longer than most people expect. (for alts)
The key observation is this:
Most altcoins have still not reclaimed or exceeded their previous all-time highs.
Historically, that type of price behavior is more commonly associated with accumulation than with the final stages of a market cycle.
And that distinction may prove to be extremely important over the coming years. l🧵1/9👇🏽
$TROLL
Price went down.
And suddenly, the bulls started showing up again.
No euphoria. No breakout. Just a reaction to the dip.
Makes you wonder what they’re seeing that the rest of the market isn’t.
Maybe they’re looking at what TROLL could become, not what it looks like today.


$WOJAK
The market has a funny habit of ignoring something for months, only to act like it was obvious once it finally moves.
WOJAK is still in the part of the story nobody wants to read.
An OG from the trenches. Built through the silence, the boredom and the endless cycle of people giving up.
Maybe that’s why I like it.
Because when the attention finally comes, the chart won’t need an introduction.
They’ll know.

$BTC + $USDT.D l Weekly
There’s a pattern on this chart that goes all the way back to 2018.
Every time the RSI dropped to 30, the market reached a bottom.
And once again, the market bottomed at that exact level.
History doesn’t have to repeat perfectly.
But when the same signal keeps appearing at major turning points, it deserves attention.
So now I have one question:
If this signal has called every major bottom since 2018, why would you ignore it now ?

$GOLD l Monthly
Gold is at a critical moment here.
I believe we’re likely to see another push towards the highs before the broader downtrend takes over for the next few years.
Curious to see how this plays out.


$GOLD
I struggle to see a scenario where Gold continues making new all-time highs over the coming years.
After such an extended multi-year rally, I believe the biggest move has already happened.
2001–2011: ~10-year supercycle.
2015–2026: ~11-year supercycle.
History doesn't repeat perfectly, but it often rhymes.
To me, the next major opportunity lies elsewhere.

$OTHERSBTC l Weekly Exluding stablecoins
The structure is starting to tell a much bigger story.
When you remove stablecoins from OTHERSBTC, the chart begins to mirror the 2016 accumulation phase while also following the 2018–2020 market structure.
But there’s one detail that stands out.
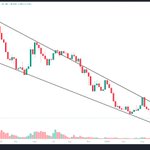
In 2016, the falling wedge lasted around 4.5 months.
The current falling wedge has been developing for 4 years and 9 months.
It’s also confirming the path ahead: breakout and retest.
We could be looking at a 2017 - 2018 style supercycle, most likely on an even bigger scale.
Most people will only recognize it once the move is already underway.
Don’t be one of them.

$BTC
Midcycle, bro.
They called the cycle dead and wrote off everything within it.
Now they’re facing a disturbingly aggressive bullrun.
Major accounts kept pushing the bear market narrative while those who did their own research stayed focused on the bigger picture.
Those following influencers blindly may end up chasing price once the market moves into its next phase.
There are more voices selling narratives than people doing real analysis.
Price is higher, yet many who called for lower prices still refuse to turn bullish because doing so would mean admitting their thesis was wrong.
And here’s the irony: when the crowd finally turns bullish, that’s often when the next local top forms.
They’ll chase the breakout, buy the top, and panic-sell when the next pullback lasts longer than they expected.
The market doesn’t care about your bias.
It rewards those who can adapt.


$BRETT 🐸🔵
While the market was looking elsewhere, BRETT kept growing.
Since May, the community has added 7,000+ holders.
The chart doesn’t tell the whole story.
Sometimes, the most important developments happen beneath the surface, long before the market pays attention.
The market may be sleeping on BRETT, but the community isn’t.


$WOJAK - Little Thesis
1. The First Signal: Timing
Some memes catch your attention because they’re trending.
Others start to look different when you step back and consider the broader context.
For me, WOJAK falls into the second category.
The first thing that caught my attention wasn’t the price action.
It was the timing.
Around the period when BTC and ETH were forming their bottoms, while sentiment was at its absolute worst, Binance started featuring WOJAK as its profile picture on X.
Not because a Binance mention automatically makes a meme bullish, but because of when it happened.
That was the first signal.
2. The Bigger Picture: 4chan Culture
WOJAK isn’t just another crypto meme.
It is deeply connected to 4chan culture and is recognizable far beyond crypto.
When I started looking deeper, I noticed something interesting across other 4chan memes: even some of the smaller caps have incredibly strong holders who have survived the worst phases of the cycle without selling.
At the same time, similar chart structures are appearing across these memes.
And one chart keeps standing out: $TROLL.
3. The TROLL and PEPE Connection
If you’ve been watching TROLL, you know what kind of moves it has already made.
When you compare its structure with what happened with $PEPE, it becomes difficult for me to believe that all of this is completely random.
This is why I believe we could be looking at something much bigger than a few isolated meme coins.
A 4Chan meme supercycle.
4. Holder Behavior: Weak Hands vs. Strong Hands
Weak hands are selling, Strong hands are absorbing.
Meanwhile, the holder count continues to increase.
That’s the kind of behavior I want to see before a narrative becomes mainstream.
You don’t need everyone to believe yet.
You want conviction and accumulation to develop before the crowd starts paying attention.
5. The Whale and the Double Bottom
Look at the WOJAK chart.
This whale has played a major role in the double bottom that is forming.
I’m not saying you should blindly follow a whale.
But when you see significant accumulation alongside a developing double bottom and a growing holder base, it becomes worth paying attention to.
Especially when the broader narrative is starting to align.
6. The Market Environment
Memes tend to perform well when liquidity and risk appetite return.
ETH is recovering, altcoins are showing signs of strength, and the broader market structure is improving.
If that rotation continues, memes could offer some of the highest-beta opportunities in the market.
That’s where the asymmetric upside becomes interesting.
7. Putting the Signals Together
When I put everything together, I don’t see just another meme sitting at a certain market cap.
I see several signals aligning
•The timing around the BTC and ETH bottoms
• Binance’s attention toward WOJAK
• The broader 4chan connection
• Strong holders and an increasing holder count
• Whale accumulation and a developing double bottom
• A market environment that could become increasingly favorable for memes
Any one of these signals alone means very little.
But when they start appearing together, that’s when the thesis becomes interesting.
8. The Conclusion: Looking Ahead
I could be wrong, but I believe there are enough signals here to take WOJAK seriously.
What I find most telling is how many major accounts are holding WOJAK without even bothering to shill it.
The price keeps bleeding, yet the holder count continues to grow.
Now imagine what happens when the price finally turns around and those same accounts start paying attention publicly.
But that’s my perspective.
I’d love to hear your thoughts too.
What conviction signals are you seeing in WOJAK ?
@wojakcto


$SOL l Daily Update
Aged well so far.
Now let’s see whether SOL rejects at $130 or pushes slightly above those highs.
I see $150 as the upper target for this move, especially with the HTF falling wedge still in play.

$SOL
Currently, on the daily:
The fact is, most charts are already showing signs of a bottom.
The problem is that these are low-volume patterns.
Low volume + steady price action is exactly the kind of environment that creates uncertainty.
But we can't ignore the fact that these structures are remarkably similar to the patterns we saw before the last move higher.
And that, to me, is bullish.


Jsha187👑 retweeted
🏛️Wojak is moving home🏛️
Through the end of October, we’re officially bringing the community together in one place and moving our core community directly into the 𝕏 chat.
The Bullposting 𝕏 Chat is our new home, built for the people who genuinely show up, hold conviction, and keep this culture moving forward.
There’s plenty of time to make the move, and our mods will be around to help everyone find their way over. The main announcement channel will stay open for important updates, while the tg community chat will close once the transition is complete.
Nothing about the heart of wojak is changing. We’re simply bringing the community closer together and concentrating the energy that has always made wojak what it is: real community, real conviction, and people who genuinely believe in wojak 🥂
Secure your spot in the 𝕏 chat here👇 xitter.cf/i/chat/group_join/g205…

$TOTAL 3
Going according to plan.
The 2018–2020 fractal is playing out, and what makes this even more interesting is how it’s aligning with the other fractals across the market.
Different charts.
Different structures.
The same underlying pattern.
The more I compare them, the more everything starts to line up.
This is exactly what I’ve been waiting for.
The bigger picture is starting to make sense.

$TOTAL3
Another chart that aligns closely with this thesis is TOTAL3.
At first glance, the current price action may appear slow and indecisive.
However, a gradual advance into a major supply zone, followed by multiple tests of that resistance, does not look unusual to me.
In fact, this type of behavior is often observed during larger accumulation phases following extended downtrends.
Markets rarely transition directly from accumulation into price discovery.
More often, they spend time grinding higher, repeatedly testing resistance while absorbing supply from participants looking to exit positions.
Each test weakens that supply.
Each rejection removes more sellers from the market.
And over time, pressure begins to build beneath the resistance level.
That is why I view the current structure as constructive rather than bearish.
The longer the market can hold higher levels while repeatedly challenging supply, the greater the probability that a meaningful breakout eventually occurs.
In other words, what many perceive as weakness may simply be the market preparing for a larger move.
And if the broader thesis is correct, that move could mark the beginning of a much larger expansion phase across the altcoin market.
2018 - 2020 / 2024 - 2026. l 🧵6/9👇🏽


Jsha187👑 retweeted
GIVEAWAY TIME
Teaming up with @WojakCTO to giveaway $500 in $ETH this Wednesday at 4pm EST
How to enter:
- RT this tweet
- Tag 3 friends in the comments
- Join us live in spaces to enter
Good luck to everyone & see you on spaces
xitter.cf/i/spaces/1jxXgBPYNDRJZ…

$WOJAK l Chart Update
Price is falling, but selling volume is declining alongside it.
That suggests selling pressure is drying up while accumulation may be taking place.
This deviation below the 8-month trendline is shaking out impatient holders before the next move higher.
The pump will come sooner or later.
Let the chart cook a little longer.


$WOJAk l Chart update
It was never random.
The move extended a bit thats all.
If we get that little dip on the majors,
while WOJAK pulls back with them,
That could be exactly what we need to complete the structure for the next leg higher.
The setup is still intact.
Be prepared.

