




Pinned Tweet
April Futures Recap
Finished the month up 12.4% on my 50k Apex account. 15 green days and 4 red days. For my first full month trading the market, I will take it.
On April 14th I had a tilt day and hit MDL. I am honestly happy it happened because it taught me a great lesson. This trading is more discretionary than my previous trading, meaning you have to be very in tune with your emotions and mental state. Discretion can be a edge, but like anything it needs to be trained and built.
Slow compounding is definitely the way in this market, to do that you need to ensure you keep the red days small.
I am finding a repeatable edge combining volume with wyckoff.
Going to start sharing more of how I trade this market and doing some trade reviews.
Excited for May ⚡️

The Auction Map
Anchor a FRVP and a VWAP from the Sunday CME open. This is your Context Map.
Every Weekly auction tells a story. Our job is to decode it and find out what the next chapter is. Along with areas where we want to participate.
This starts to become especially powerful Mid to End of the week, because the auction is now more developed.
If price is inside it is balanced. If it is outside the VWAPs it is trending and out of balance. The FRVP will show you where the different auctions from the week have been. Low volume nodes and large spikes show you where to pay attention. From here you can look to candlestick Supply/Demand/FVGS/BPRS to refine levels.
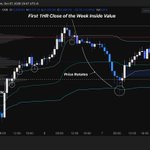
This week price opens bullish, ATH vibes, trending and respecting the Upper band VWAP (White Circles). Notice how on the 1H we can't even close a candle near it?
From there we finally close a candle below it. Here is when you pay attention. For potential short plays to take back to fair weekly value value.
Price Rotates all the way down to the lower band and wicks it hard. Seeing this on the 1Hr can then give you confidence to take the Judas swing price forms on the NY open.
The Auction map helps you build A+ context, and it shows you the areas to actually want to trade.
Lets see what story the rest of the week tells.

Amazing value provided here. NQ is the best market in the world to day trade. Will Forever be a student to the game.
Was quiet on X this week. Had to lock in and focus on myself and my trading behaviour. Will be back next week 🤝📈
Hope everyone had a great week.

Today was NFP (Non-Farm Payroll), a high-impact news day. With it came two SWT⭐️ models, one being the newest addition I have been working with
MMXM🪐
Price delivery was extremely clean; let's break it down, as well as where I went wrong, resulting in max pain and a new rule being created for myself that is long overdue ⬇️🧵.

High of day caught on $NQ playing the LVN.
The level was preplanned in the Discord.
Order flow confirmed it.
When you see aggressive market buying into your POI, followed by sellers stepping in and trapping those buyers above, that is a huge +1.
I can't believe I used to trade NQ without watching real time CME order flow data.
It is like placing an X ray machine over your candles and seeing what is actually happening beneath the surface.


$NDAQ
Today's IB model, super routine. Have seen this many times now and am comfortable to put risk on for it.
Any time the daily session VWAPS overlap with supply/demand pro trend, and we have good stats it is a trade I take.
I played this by limiting the demand with my stop below it. Once we got the bounce I added more size and moved my stop loss to the new low, targeting the high.
I left a 1 contract runner for the london highs, but after a SMT with ES I closed the remainder.
GG's, Anyone else catch this?


#SWTIBMODEL
Kicking off the week with a 6.5R IB model on $NQ
Stats Favoured the low to get taken if the high formed first @edgeful
LTF Wyckoff model in Asia session open supply to provide the entry.
LTF Absorption at the Wyckoff high and a large seller stepping in after to provide the confidence to snipe the entry.
Ran it past the IB low to take out the Daily low.
The week begins 📈

Giving this a go! Let’s see


🧪 DROP #003. Someone’s gonna clear this challenge in a day. First one to do it, @ us.
go.topstep.com/3KLabs

Perfect example of what I referenced in this tweet on $MNQ this morning.
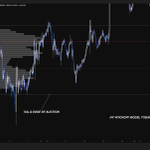
High probability place to take wyckoff models on the edges of the auction.
In my second picture I highlight what the order flow looked like in the second tap of the Wyckoff.
Trapped sellers = Passive buyers getting filled.
Absolutely beautiful trade.


FRVP/Wyckoff Context
Using the Fixed Range Volume Profile to Identify High Context Locations for Wyckoff Models in Balanced Auctions
Many traders try to "pattern" trade Wyckoff models.
What they fail to realize is that they are missing the most important part of the equation.
Location.
The FRVP is one of the most valuable tools a Wyckoff trader can have.
The highest probability accumulations and distributions often develop at the extremes, or edges, of an auction.
Markets spend approximately 70% of their time in balance.
Rather than automatically looking for breakouts at the highs and lows of a balanced auction, these are the areas where I begin looking for clean Wyckoff models that can take price back toward fair value.
At value area high, I am looking for signs of distribution.
At value area low, I am looking for signs of accumulation.
This applies across all time frames, whether you are day trading or swing trading.
The POC is important because it represents the price where the most volume has traded. It is an area where buyers and sellers have established fair value.
However, that does not necessarily make it a high quality location for execution.
I want to trade where buyers and sellers begin to disagree on fair value.
In a balanced auction, participants become less willing to buy near the highs and less willing to sell near the lows.
The key is understanding which participants are active at those extremes.
Late and less informed participants often chase price higher near the top of an auction or sell emotionally near the bottom. This is essential to the Wyckoff process.
For larger participants to build or distribute meaningful inventory, they need enough opposing liquidity to fill their orders.
The extremes of an auction are often where that liquidity becomes available.
The Volume Profile identifies the location.
The Wyckoff model confirms the reaction.
Start looking for your Wyckoff models at the extremes rather than in the middle of fair value. Improving your location will immediately improve the quality of the setups you take.

$NDAQ
#SWTIBMODEL
Another one.
Great week for the IB's so far.
Retrace into LVN with 86% stats = press green button

NY #IBMODEL
Structure was bearish.
We retrace back into NYVWAP
Buyers get absorbed in the LVN.
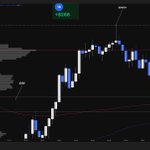
-679 delta appears on the tape (Red Bubble). This was by far the biggest orders of the session thus far.
Once I saw result from the effort I shorted with my stop above the big orders, targeting IB low.
Clear?


Tried out @MrZincx method tonight.
L on the short , W on the long = BE on the Globex IB.
The aggressive reclaim of VWAP gave me the confidence to try it after the loss.
Lets see what Asia brings


Andddd... We are off to the races in a brand new trading week. Globex #SWTIBPLAY on $MNQ
Price opened bullish with a gap below
@edgeful stats showing that in the last 6 months, if the low formed first and high second, 75% of the time we have taken out the IB high.
Beautiful CVD divergence that I showcase in the video. Along with LTF absorption on the delta profile.
Globex VWAP backing us for higher.
This is also a MSC model, combined with the IB play.
I originally limited demand, I then added to the position as it developed because I liked it so much.
Video is nice and short.
Took it on a 25K eval and also my funded account.
Lets crush it this week! ⚡️

ATV retweeted

SWT⭐️ Trading System Initial Public Reveal
Recently, SWT was revealed live to the Solari Capital inner circle. This presentation is meant to debut all the models currently in the system at launch.
@0xATV touches on some of the volume aspects and statistic-based edges within the system as well.
This debut is meant to help you understand my content on X and YouTube in a transparent manner and the terminology I have been using and will continue to use in future posts ⚡️
Statistics and Probabilities
When I was younger, my friends and I would go to the casino and play red or black on roulette.
Whenever one colour appeared several times in a row, I assumed the wheel was due to flip.
Five reds in a row?
Surely black had to be next.
If it landed on red again, I became even more convinced that black was due because another red felt increasingly unlikely.
That is the gambler’s fallacy.
Each spin is independent. The wheel does not remember the previous result.
Roulette is not exactly 50/50 because of the zero, but the probability of black does not increase simply because red appeared five times in a row.
Your previous trade works the same way.
After three losses, your next setup is not due to win.
After three wins, your next setup is not automatically more likely to lose.
Market conditions can change the probability of a setup. The outcome of your previous trade cannot.
If the context, setup and execution criteria remain the same, the probability belongs to the setup itself, not the sequence of results preceding it.
Your edge is revealed across a large sample size.
This is why data is so important in trading.
You can take multiple losses in a row and begin doubting yourself, switching strategies or going on tilt because it feels like the market has it out for you.
Without data, normal variance can feel like failure.
With data, you understand the losing streaks your strategy has historically produced and can determine whether you are experiencing normal variance, executing poorly or trading under conditions where your edge is weaker.
A losing streak does not automatically mean your strategy has stopped working.
Sometimes, it is simply part of the distribution.
If you want to stand a chance in this game, it is imperative that you train your mind to think in probabilities.
Stop treating individual outcomes like they owe you something.

$NDAQ
Text Book IB Play today on New York.
The SWT IB play becomes very high probability if it also has a Ltf Wyckoff. Extremely high win rate on this set up.
@edgeful stats showed a 69% chance we take the high if the low is formed first on Thursdays.
This was a MSCM, Wyckoff and the SWT IB play all in one. Amazing to see when you can stack confluences.
Anyone else smack this? ⚡️
