




Pinned Tweet
Coming soon: the T-REX 2X Long Anthropic Daily Target ETF. $CLAU.
The Fund seeks daily investment results, before fees and expenses, of 200% of the daily performance of Anthropic.
Investing in the Fund is not equivalent to investing directly in Anthropic.
Get launch updates: rexshares.com/anthropic/

7
2,503
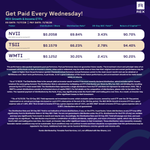
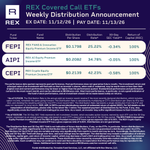
Get Paid Every Wednesday.
Our Growth & Income Suite offers access to ETFs with the potential for income on a weekly distribution schedule.
Annualized Distribution Rates:
$NVII: 69.84%
30-Day SEC Yield: 3.43%
Return of Capital (ROC): 90.70%
$TSII: 66.23%
30-Day SEC Yield: 2.78%
Return of Capital (ROC): 94.40%
$WMTI: 30.20%
30-Day SEC Yield: 2.41%
Return of Capital (ROC): 90.20%
View each fund’s prospectus here:
NVII & TSII Prospectus: rexshares.com/wp-content/upl…
WMTI Prospectus: rexshares.com/wp-content/upl…
NVII Fund Info and Standardized Performance: rexshares.com/nvii/
TSII Fund Info and Standardized Performance: rexshares.com/tsii/
WMTI Fund Info and Standardized Performance: rexshares.com/wmti/
*As of 11/16/26. The Distribution Rate is the annual yield an investor would receive if the most recently declared distribution, which includes option income, remained the same going forward. The Distribution Rate is calculated by multiplying an ETF’s Distribution per Share by fifty-two (52), and dividing the resulting amount by the ETF’s most recent NAV. The Distribution Rate represents a single distribution from the ETF and does not represent its total return.
**As of 10/31/26. The 30-Day SEC Yield represents net investment income, which excludes option income, earned by such ETF over the 30-Day period, expressed as an annual percentage rate based on such ETF’s share price at the end of the 30-Day period.
NVII, TSII, & WMTI's current distributions consist of 100% estimated return of capital (ROC). For full details on the composition of distributions, please refer to the latest 19a-1 notices. The REX NVDA Growth & Income ETF has a gross expense ratio of 1.49%, the REX TSLA Growth & Income ETF has a gross expense ratio of 1.52%, and the REX WMT Growth & Income ETF has a gross expense ratio of 0.99%. There is no guarantee that the Funds will be successful in their attempt to provide leveraged exposure to the underlying stocks or pay weekly distributions.
The Funds are not suitable for all investors. These distribution rates caused by unusually favorable market conditions may not be sustainable. Such conditions may not continue to exist and there should be no expectation that this performance may be repeated in the future. The performance data quoted represents past performance. Past performance does not guarantee future results. The investment return their original cost and current performance may be lower or higher than the performance quoted. Performance current to the most recent month-end can be obtained by calling 1-844-802-4004. Short term performance, in particular, is not a good indication of the fund’s future performance, and an investment should not be made based solely on returns.

3
1,297
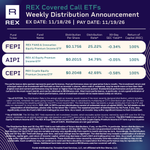
Weekly Distribution News for $FEPI $AIPI & $CEPI Holders!
Payout Date: 11/19/26
Distribution for $FEPI
Amount: $0.1756
Distribution for $AIPI
Amount: $0.2015
Distribution for $CEPI
Amount: $0.2048
FEPI Prospectus: rexshares.com/wp-content/upl…
FEPI Fund Info and Standardized Performance: rexshares.com/fepi/
AIPI Prospectus: rexshares.com/wp-content/upl…
AIPI Fund Info and Standardized Performance: rexshares.com/aipi/
CEPI Prospectus: rexshares.com/wp-content/upl…
CEPI Fund Info and Standardized Performance: rexshares.com/cepi/

$NVDA reported Fiscal Q3 2027 earnings after the bell today.
Adjusted EPS: expected $2.47, reported $2.68
Beat: +8.50%
Revenue: expected $108.71B, reported $115.8B
Beat: +6.52%
Highlights:
• Data Center revenue: $107.6B, up 110% YoY
• Revenue up 103% YoY, up 20% QoQ
• GAAP / non-GAAP gross margin: 74.8% / 74.9%
• Q4 FY2027 revenue outlook: $130.0B, plus or minus 3% (quarter includes an extra week), assuming no Data Center compute revenue from China
• Returned $28.1B to shareholders in the quarter; ~$227.3B remaining under repurchase authorization after a $150B increase in September
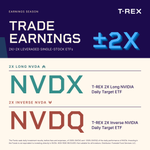
$NVDX (2X Long NVDA) and $NVDQ (2X Inverse NVDA) offer 2X daily exposure to $NVDA.
rexshares.com/nvdx

NVIDIA’S BOARD NOW HAS A NATIONAL SECURITY COMMITTEE
$NVDA’s security and trade compliance teams will report to it directly.
Big Tech boards oversee compliance, but a panel this focused is more common at defense contractors.
A sign of where chips are headed?
We are excited to announce the November distributions for the REX Autocallable Income ETFs, $ATCL & $DACL
Pay date: 11/18/2026
The REX Autocallable Income ETF
$ATCL Amount: $0.2673
The REX Defensive Autocallable Income ETF
$DACL Amount: $0.1435
ATCL Prospectus:
rexshares.com/wp-content/upl…
ATCL Fund Info and Standardized Performance:
rexshares.com/atcl/
DACL Prospectus:
rexshares.com/wp-content/upl…
DACL Fund Info and Standardized Performance:
rexshares.com/dacl/

Distribution News for REX Growth & Income ETF Holders!
Pay date: 11/18/2026
REX NVDA Growth & Income ETF $NVII
Amount: $0.2058
REX TSLA Growth & Income ETF $TSII
Amount: $0.1579
REX WMT Growth & Income ETF $WMTI
Amount: $0.1252
*As of 11/16/26. The Distribution Rate is the annual yield an investor would receive if the most recently declared distribution, which includes option income, remained the same going forward. The Distribution Rate is calculated by multiplying an ETF’s Distribution per Share by fifty-two (52), and dividing the resulting amount by the ETF’s most recent NAV. The Distribution Rate represents a single distribution from the ETF and does not represent its total return.
**As of 10/31/26. The 30-Day SEC Yield represents net investment income, which excludes option income, earned by such ETF over the 30-Day period, expressed as an annual percentage rate based on such ETF’s share price at the end of the 30-Day period.
***NVII, TSII, & WMTI’s current distributions consist of estimated return of capital (ROC). For full details on the composition of distributions, please refer to the latest 19a-1 notices. The REX NVDA Growth & Income ETF has a gross expense ratio of 1.49%, the REX TSLA Growth & Income ETF has a gross expense ratio of 1.52%, and the REX WMT Growth & Income ETF has a gross expense ratio of 0.99%. There is no guarantee that the Funds will be successful in their attempt to provide leveraged exposure to the underlying stocks or pay weekly distributions.
The Funds are not suitable for all investors. These distribution rates caused by unusually favorable market conditions may not be sustainable. Such conditions may not continue to exist and there should be no expectation that this performance may be repeated in the future. The performance data quoted represents past performance. Past performance does not guarantee future results. The investment return their original cost and current performance may be lower or higher than the performance quoted. Performance current to the most recent month-end can be obtained by calling 1-844-802-4004. Short term performance, in particular, is not a good indication of the fund’s future performance, and an investment should not be made based solely on returns.
NVII, TSII, & WMTI Prospectus: rexshares.com/wp-content/upl…
NVII Fund Info and Standardized Performance: rexshares.com/nvii/
TSII Fund Info and Standardized Performance: rexshares.com/tsii/
WMTI Fund Info and Standardized Performance: rexshares.com/wmti/


U.S. Market Events This Week
Monday
Fed Chair Warsh Speaks
CFTC S&P 500 speculative new positions
Tuesday
API Weekly Crude Oil Stock
Retail Sales
ADP Employment Change Weekly
$NVDA Earnings
Wednesday
Crude Oil Inventories
FOMC Meeting Minutes
Housing Starts
Thursday
Initial Jobless Claims
Crude Oil Inventories
Fed's Balance Sheet
Friday
U.S. Baker Hughes Total Rig Count
Fed Waller Speaks
BLACKSTONE BETS $1.5 BILLION ON PFIZER’S MONTHLY OBESITY SHOT
$BX will invest up to $1.5 billion in $PFE’s obesity program, one of the private equity firm’s largest biotech bets, funding as many as 10 Phase 3 trials of berobenatide, a potential once monthly injection $PFE landed after outbidding Novo Nordisk for Metsera with a $10 billion offer that roughly doubled its opening bid. Obesity trials are especially costly because they require thousands of volunteers studied for more than a year, and $PFE may run head to head studies against $LLY’s Zepbound and Novo Nordisk’s Wegovy on top of placebo controlled trials to sharpen its commercial pitch. In return for the funding, which will be phased through 2028, $PFE will pay $BX milestones if the FDA approves the drug for weight management and it hits certain sales goals, letting $PFE push its obesity program forward while keeping cash free for the rest of its pipeline.
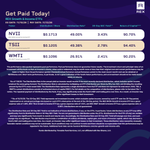
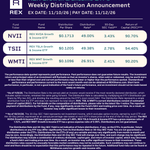
Get Paid Today.
Our Growth & Income Suite offers access to ETFs with the potential for income on a weekly distribution schedule.
Annualized Distribution Rates:
$NVII: 49.00%
30-Day SEC Yield: 3.43%
Return of Capital (ROC): 90.70%
$TSII: 49.38%
30-Day SEC Yield: 2.78%
Return of Capital (ROC): 94.40%
$WMTI: 26.91%
30-Day SEC Yield: 2.41%
Return of Capital (ROC): 90.20%
View each fund’s prospectus here:
NVII & TSII Prospectus: rexshares.com/wp-content/upl…
WMTI Prospectus: rexshares.com/wp-content/upl…
NVII Fund Info and Standardized Performance: rexshares.com/nvii/
TSII Fund Info and Standardized Performance: rexshares.com/tsii/
WMTI Fund Info and Standardized Performance: rexshares.com/wmti/
*As of 11/9/26. The Distribution Rate is the annual yield an investor would receive if the most recently declared distribution, which includes option income, remained the same going forward. The Distribution Rate is calculated by multiplying an ETF’s Distribution per Share by fifty-two (52), and dividing the resulting amount by the ETF’s most recent NAV. The Distribution Rate represents a single distribution from the ETF and does not represent its total return.
**As of 10/31/26. The 30-Day SEC Yield represents net investment income, which excludes option income, earned by such ETF over the 30-Day period, expressed as an annual percentage rate based on such ETF’s share price at the end of the 30-Day period.
NVII, TSII, & WMTI's current distributions consist of 100% estimated return of capital (ROC). For full details on the composition of distributions, please refer to the latest 19a-1 notices. The REX NVDA Growth & Income ETF has a gross expense ratio of 1.49%, the REX TSLA Growth & Income ETF has a gross expense ratio of 1.52%, and the REX WMT Growth & Income ETF has a gross expense ratio of 0.99%. There is no guarantee that the Funds will be successful in their attempt to provide leveraged exposure to the underlying stocks or pay weekly distributions.
The Funds are not suitable for all investors. These distribution rates caused by unusually favorable market conditions may not be sustainable. Such conditions may not continue to exist and there should be no expectation that this performance may be repeated in the future. The performance data quoted represents past performance. Past performance does not guarantee future results. The investment return their original cost and current performance may be lower or higher than the performance quoted. Performance current to the most recent month-end can be obtained by calling 1-844-802-4004. Short term performance, in particular, is not a good indication of the fund’s future performance, and an investment should not be made based solely on returns

10
2,736
When a hyperscaler announces capex, nobody ships a machine that quarter. The money gets committed, capacity gets planned, tools get ordered, and only then does equipment get built, delivered and installed. REX estimates 12 to 18 months from one end to the other.
This means the spending announced over the past year is still working its way toward the companies that make the equipment.
The REX AI Chipmaking ETF ($CHIP) holds that end of the chain.
See how the fund is built: rexshares.com/chip

1
3
2,454