Resagratia (@ResaData) header
Resagratia (@ResaData) profile picture

Tech Skills Development | Find Tech Jobs in Africa | Software Development 馃摠 servus@resagratia.com

Africa
Joined June 2019
Photo by Resagratia (@ResaData)Photo by Resagratia (@ResaData)Photo by Resagratia (@ResaData)Photo by Resagratia (@ResaData)Photo by Resagratia (@ResaData)Photo by Resagratia (@ResaData)Photo by Resagratia (@ResaData)Photo by Resagratia (@ResaData)Photo by Resagratia (@ResaData)Photo by Resagratia (@ResaData)
That voice in your head saying "I want more"? It's time to listen. More than just a different job a better-paying, global, tech-focused career. Don't let the rest of 2025 just pass by. Use it to build the future you want. resagratia.com/bootcamp #ResaDataBootcamp #DataAnalytics #Datascience
2
4
784
Resagratia retweeted
just shipped a web app for NAFDAC verification way cleaner UI than the official site free, fast, actually works on mobile 9jacheckr.xyz/verify
25
83
6
414
11,912
SQL Project Ideas For Data Analyst
1
1
110
Types of Databases
1
1
116
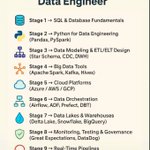
Roadmap to Become a Data Engineer
80
Excel Keyboard Shortcut Keys!!!
77
The most common mistakes in Power BI Projects
77
Optimized Practices for using ChatGPT with Excel
76
Excel vs. Power BI: Choosing the Right Tool for Your Data Needs
1
1
14
657
Monday sets the stage for an incredible week, a fresh opportunity to learn, grow, and pursue your goals! #mondaymotivation #ResaDataBootcamp #DataAnalytics #DataScience
1
119
A must-have skill for any data wizard!
1
113
Excel Shortcuts馃
1
1
131
A simple way to remember SQL Joins !!
2
77
7 In-Demand Data Analytics Skills
2
1
78
Excel Shortcuts馃憣 Ultimate time saver for Excel users馃 #ResaDataBootcamp #DataAnalytics #DataScience
1
6
365
Handy Excel Features 馃憣
75
How do you use Excel?
1
162
A simple guide on how to choose the right graph for data visualization.
94
Resagratia retweeted
new way of telling someone they鈥檙e old
Replying to @ExcelHumor
I鈥檝e literally never used vlookup
21
42
2
519
48,414
In data analysis, clarity is king. The effectiveness of your insights often hinges on choosing the appropriate visualization. By being intentional with our chart choices, we ensure our message is not only seen but understood, driving better decisions. #ResaDataBootcamp #DataAnalytics #DataScience
1
80
Excel vs SQL vs Python
78