



ALT An illustrated diagram from the Review Article "Helicobacter pylori Infection — Advances, Challenges, and the Road Ahead" that shows culture-based and molecular-based antimicrobial-susceptibility testing for H. pylori.

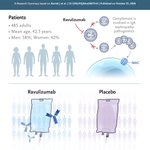
ALT This image contains an excerpt from the Research Summary "Ravulizumab in IgA Nephropathy — Interim Analysis of a Phase 3 Trial” published in the New England Journal of Medicine. It includes a diagram of a complement involved in IgA nephropathy pathogenesis. There are illustrations for two treatment groups: "Ravulizumab" with 240 individuals and "Placebo" with 245 individuals. Additional text summarizes study demographics, noting 485 adults with a mean age of 42.5 years. A prompt to read the full Research Summary at NEJM.org sits at the bottom.

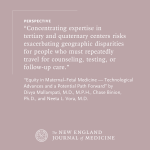
ALT A quote from a Perspective published in the New England Journal of Medicine reads as follows: "Concentrating expertise in tertiary and quaternary centers risks exacerbating geographic disparities for people who must repeatedly travel for counseling, testing, or follow-up care.” The Perspective is titled "Equity in Maternal–Fetal Medicine — Technological Advances and a Potential Path Forward” and the authors are Divya Mallampati, M.D., M.P.H., Chase Binion, Ph.D., and Neeta L. Vora, M.D. The background color is brown and includes the NEJM identity.


ALT Promotional image for episode 48 of the NEJM AI Grand Rounds podcast. The title of the episode is "Hippocratic AI’s Munjal Shah on Building Safe AI." Includes a photo of Munjal Shah, who is the special guest.

ALT A photo from the Images in Clinical Medicine article "Lung Hernia with a Chest-Wall Bulge" shows a patient with a visible chest-wall bulge sitting in a hospital room.

ALT A quote from an NEJM Voices blog post reads as follows: “When visitors are present, pay attention to the emotional weather in the room. . . . Patients who are joking around while they wait are usually doing well. When visitors are checking their phones and disengaged, they are telling you something about what support looks like at home.” The author is Michelle Kittleson, M.D. The background color is purple and includes the NEJM Voices logo.

ALT A bullet list of key points from the Review Article "Preventing Malaria Infections and Moving toward Malaria Elimination" on a yellow background. The New England Journal of Medicine identity sits at the bottom.

ALT Bar chart titled "Limits to AI Substitution across Specialties: Composition of Medicare Part B Payments Including E&M Services." The chart shows percentages of "Physical," "E&M," and "Nonphysical" services across 15 medical specialties and all overall (US$44.9bn). Total 2023 Medicare Part B payments are shown in parentheses (US$ bn); amounts are in billions of U.S. dollars.


ALT This image contains an excerpt from the Research Summary “Prasugrel versus Ticagrelor in Acute Coronary Syndromes” published in the New England Journal of Medicine. It shows a diagram of a heart with a highlighted artery and information about trial participants: 17,095 adults, mean age 69.8 years, with 27.8% identified as women. There are illustrations of two medication bottles labeled ticagrelor and prasugrel, each accompanied by participant numbers: N=9444 for ticagrelor, N=7651 for prasugrel. A prompt to read the full Research Summary at NEJM.org sits at the bottom.

ALT The image contains two panels showing changes in BMI at weeks 68 and 104. Panel A shows mean percent changes from baseline in the BMI. The graph on the left shows estimated mean changes at week 68 for the treatment-regimen estimand and the hypothetical efficacy estimand; the graph on the right shows observed mean percent changes over time from randomization to week 104 for the hypothetical on-treatment period. In Panel B, the graph on the left shows the percentages of participants who had a reduction in BMI category at week 68 and at week 104 for the in-trial observation period, as calculated with the treatment-regimen estimand; observed percentages of participants within each BMI category at baseline, week 68, and week 104 for the in-trial period are shown to the right.

ALT Three medical images from the Images in Clinical Medicine article “Lung Hernia with a Chest-Wall Hematoma.” Panel A: A photo of a large ecchymosis on the left chest wall. Panel B: A chest radiograph showing a patchy opacity at the left lung base. Panel C: Computed tomography of the chest revealing herniation of the left lower lobe between the eighth and ninth ribs with ground-glass opacities at the site of the hernia.

ALT Selected differences between traditional and AI-enabled mass surveillance are presented in a table with two columns. Categories such as regulation, data integration, automation, and public health risks are compared between the two surveillance types: "Traditional Surveillance" and "AI-Enabled Surveillance."

ALT Three panels showing the changes from baseline in 24-hour urinary protein-to-creatinine ratio. Panel A is a bar chart that shows the change from baseline in the 24-hour urinary protein-to-creatinine ratio at week 34 (primary end point). Panel B is a graph shows the change from baseline in the 24-hour urinary protein-to-creatinine ratio at weeks 10, 26, and 34; from the mixed model for repeated measures. Panel C is a bar chart that shows the percentage of patients with a 50% or greater reduction from baseline in the 24-hour urinary protein-to-creatinine ratio at weeks 10, 26, and 34.


ALT The image is page 1 of the Public Health Alerts report "Outcomes among Pregnant Women with Measles and Their Infants in the United States — Preliminary Analysis, 2025–2026" published in NEJM Evidence in partnership with Center for Infectious Disease Research and Policy (CIDRAP) at the University of Minnesota. A slate banner at the bottom encourages readers to access the full report at evidence.nejm.org.

ALT This image is a composite of multiple panels showing interferon-γ–associated tissue inflammation and therapeutic responses in thymoma-associated immune dysregulation. Panel A displays histologic analysis images of esophagus, duodenum, and bone marrow tissues at various magnifications. Panel B is a scatter plot showing serum CXCL9 levels in 34 study patients. Panel C has graphs illustrating changes in CXCL9 and IFN-γ expression upon cyclosporine treatment. Panel D shows serum CXCL9 levels and clinical response in Patient 1. Panel E presents the frequency of oral candidiasis episodes in Patient 2. Panel F contains line graphs of hemoglobin and albumin levels in Patient 3.

ALT A quote from an NEJM Voices blog post reads as follows: “Cancer is a social disease. If we, as oncologists and other health care providers who see people with cancer, are committed to improving the quality of life following a cancer diagnosis, we need to see intimate partners as patients too.” The author is Don Dizon, M.D. The background color is blue and includes the NEJM Voices logo.

ALT This image contains an excerpt from the Research Summary "Prevention of VTE after Total Hip or Knee Replacement” published in the New England Journal of Medicine. It shows a diagram of venous thromboembolism after total hip or knee arthroplasty. Three medications are compared: aspirin, warfarin, and rivaroxaban, with participant numbers listed for each. A prompt to read the full Research Summary at NEJM.org sits at the bottom.

ALT Graph showing percent change in BMI over 104 weeks since randomization. Two lines are displayed: "Semaglutide" in blue and "Placebo" in gray. Mean BMI at baseline is 32.4. I bars indicate standard errors.