

Enabling smarter investment decisions & better client engagement. Free trial: https://xitter.cf/t.co/2GGVDn72Fm #YCharts
Chicago, IL
Joined March 2009
- Tweets11.4K
- Following6.8K
- Followers40.4K
- Likes14.1K





Pinned Tweet
Did you know missing just 10 days in the stock market could have cost you over $650,000?
A $100,000 investment in the S&P 500 over 25 years:
• Stayed invested: $1.17M
• Missed 10 best days: $522K
• Missed 20 best days: $304K
• Missed 50 best days: $101K
One chart can tell a powerful story.
That's why YCharts put together 10 must-see visuals to help financial advisors simplify complex market topics, educate clients, and win new business.
Check out the full report here: go.ycharts.com/the-top-10-vi…


The S&P 500 gained around $400 billion in market cap today...
🟢 Nasdaq +1.13%
🟢 Dow Jones +0.69%
🟢 S&P 500 +0.58%

BREAKING: Meta just reported earnings and announced a 2-for-1 stock split...
🟢 Revenue: $64.60B vs. $63.33B expected (+26% YoY)
🔴 EPS: $3.83 vs. $5.89 expected
📊 Daily Active People: 3.64B (+3% YoY)
$META also announced plans to issue a new class of non-voting shares, effectively creating a 2-for-1 stock split beginning in January 2027.
The move will allow Meta to raise capital for its massive AI investments while preserving Mark Zuckerberg's voting control
YCharts retweeted

A year ago I noticed the drinking fountains at my Planet Fitness weren't ice cold anymore
The water is now room temp
Should've shorted the stock then
It's down 50% this year
(I still don't understand how they only charge $10/month)


This is pretty crazy...
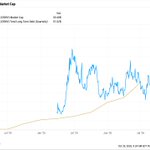
"CoreWeave has a market cap of less than $34 billion, but has more than $51 billion in total long term debt"
Great post by @RyanDetrick

In each of the nine previous cycles, the S&P 500 was higher 12 months after Election Day...
The average total return over that period was 16.9%, with the best year coming after 1994, when the market advanced by over 30%.
This streak isn’t just limited to the past 35 or so years, either. Since the index was established in the 1950’s, there has never been a negative return in the 12 months following a midterm election.
However, 2026 is shaping up differently. Despite historical weakness during midterm years, the S&P 500 has already gained nearly 15% this year.
With elevated Treasury yields, persistent inflation, and geopolitical uncertainty, will the market follow its historical election cycle or break the trend?
Read our full "2026 Midterm Election: How Do Markets Historically Respond?" blog: get.ycharts.com/resources/bl…

Third-quarter earnings season is heating up, with several major S&P 500 companies making big moves following their latest results.
📈 Top Gainers:
• Equifax ($EFX): +10.54% — Q3 adjusted EPS of $2.26 beat estimates of $2.20.
• Hasbro ($HAS): +6.19% — Adjusted EPS of $2.90 crushed expectations of $1.86, while the company raised its 2026 revenue growth outlook.
• Northrop Grumman ($NOC): +6.18% — EPS of $7.89 topped estimates of $7.18, with management raising full-year guidance.
• 3M ($MMM) — Beat earnings expectations and raised its full-year outlook.
📉 Top Losers:
• General Motors ($GM): -4.93% — Shares fell after the company narrowed its 2026 earnings guidance.
• Baxter International ($BAX): -3.30%
• Howmet Aerospace ($HWM): -2.92%
Earnings season is just getting started, and investors are paying close attention to both quarterly results and forward guidance.
Data via YCharts.

In each of the nine previous cycles, the S&P 500 was higher 12 months after Election Day...
The average total return over that period was 16.9%, with the best year coming after 1994, when the market advanced by over 30%.
This streak isn’t just limited to the past 35 or so years, either. Since the index was established in the 1950’s, there has never been a negative return in the 12 months following a midterm election.
However, 2026 is shaping up differently. Despite historical weakness during midterm years, the S&P 500 has already gained nearly 15% this year.
With elevated Treasury yields, persistent inflation, and geopolitical uncertainty, will the market follow its historical election cycle or break the trend?
Read our full "2026 Midterm Election: How Do Markets Historically Respond?" blog: get.ycharts.com/resources/bl…
The presidential election cycle has historically had a major impact on stock market performance...
With the 2026 midterm elections approaching, a new YCharts analysis highlights how the S&P 500 has performed during each year of the presidential cycle since 1990.
Here's the average annual S&P 500 total return:
• Year 1 (Post-Election): +18.1%
• Year 2 (Midterm): +2.8%
• Year 3 (Pre-Election): +20.4%
• Year 4 (Election): +7.3%
Midterm years have historically been the weakest, while the year following midterm elections has delivered the strongest average returns.
Even more interesting: The S&P 500 has finished higher 12 months after every midterm election since 1990, with an average gain of 16.9%.
However, 2026 is shaping up differently. Despite historical weakness during midterm years, the S&P 500 has already gained nearly 15% this year.
With elevated Treasury yields, persistent inflation, and geopolitical uncertainty, will the market follow its historical election cycle or break the trend?
Read the full analysis: get.ycharts.com/resources/bl…

YCharts retweeted

YTD Style Factor Performance via @ycharts
The momentum style factor is reverting to the mean 👇

This is interesting by @awealthofcs...
"I keep hearing about a bloodbath under the surface and how concentrated stock market returns are this year...
But these are YTD returns:
- S&P 500 +13%
- Mid caps +10.1%
- Small caps +10.7%
- Foreign stocks +9.5%
- Emerging markets +15.4%
Looks pretty good to me"
What do you think?

The Nasdaq 100 is now down 3% on the day, putting it on pace for its worst weekly decline since April 2025...
US tech stocks have wiped out more than $3 trillion in market value over the past 10 days.
The Nasdaq 100 is now just 2.5% away from officially entering correction territory.
(h/t @KobeissiLetter)
MARKET UPDATE: The Dow Jones is pushing higher while technology stocks continue to sell off...
Here's where the major indexes stand today:
🟢 Dow Jones: +0.26% (+135 points)
🔴 S&P 500: -0.35%
🔴 Nasdaq Composite: -1.11% (-296 points)
Technology and semiconductor stocks are facing significant selling pressure, with some of the biggest declines including:
🔴 Twilio ($TWLO): -10.71%
🔴 Moderna ($MRNA): -10.19%
🔴 Super Micro Computer ($SMCI): -7.44%
Meanwhile, Microsoft ($MSFT), Alphabet ($GOOG), Broadcom ($AVGO), Meta ($META), and TSMC ($TSM) have collectively erased nearly $245 BILLION in market value today.
Market breadth is also raising concerns. Just 10 AI-related stocks have reportedly accounted for 70% of the S&P 500's gains since March, while 84% of index constituents are at least 10% below their recent highs.
The growing divergence between the Dow and Nasdaq highlights increasing pressure on technology stocks as investors reassess the AI trade.
Is this a healthy market rotation or the beginning of a broader correction?

YCharts retweeted
I keep hearing about a bloodbath under the surface and how concentrated stock market returns are this year
But these are YTD returns:
S&P 500 +13%
Mid caps +10.1%
Small caps +10.7%
Foreign stocks +9.5%
Emerging markets +15.4%
Looks pretty good to me

Anthropic’s potential IPO valuation is reportedly being cut by 25%, according to Reuters.
Some investors are now discussing a $1.5 trillion valuation, down from previous expectations of $2 trillion.
This comes even as Anthropic reported $16.8 billion in Q3 revenue, a 45% jump from the prior quarter, and posted an adjusted profit.
Despite surging revenue, investors are beginning to reassess how much the AI giant is worth.

MARKET UPDATE: The Dow Jones is pushing higher while technology stocks continue to sell off...
Here's where the major indexes stand today:
🟢 Dow Jones: +0.26% (+135 points)
🔴 S&P 500: -0.35%
🔴 Nasdaq Composite: -1.11% (-296 points)
Technology and semiconductor stocks are facing significant selling pressure, with some of the biggest declines including:
🔴 Twilio ($TWLO): -10.71%
🔴 Moderna ($MRNA): -10.19%
🔴 Super Micro Computer ($SMCI): -7.44%
Meanwhile, Microsoft ($MSFT), Alphabet ($GOOG), Broadcom ($AVGO), Meta ($META), and TSMC ($TSM) have collectively erased nearly $245 BILLION in market value today.
Market breadth is also raising concerns. Just 10 AI-related stocks have reportedly accounted for 70% of the S&P 500's gains since March, while 84% of index constituents are at least 10% below their recent highs.
The growing divergence between the Dow and Nasdaq highlights increasing pressure on technology stocks as investors reassess the AI trade.
Is this a healthy market rotation or the beginning of a broader correction?
The presidential election cycle has historically had a major impact on stock market performance...
With the 2026 midterm elections approaching, a new YCharts analysis highlights how the S&P 500 has performed during each year of the presidential cycle since 1990.
Here's the average annual S&P 500 total return:
• Year 1 (Post-Election): +18.1%
• Year 2 (Midterm): +2.8%
• Year 3 (Pre-Election): +20.4%
• Year 4 (Election): +7.3%
Midterm years have historically been the weakest, while the year following midterm elections has delivered the strongest average returns.
Even more interesting: The S&P 500 has finished higher 12 months after every midterm election since 1990, with an average gain of 16.9%.
However, 2026 is shaping up differently. Despite historical weakness during midterm years, the S&P 500 has already gained nearly 15% this year.
With elevated Treasury yields, persistent inflation, and geopolitical uncertainty, will the market follow its historical election cycle or break the trend?
Read the full analysis: get.ycharts.com/resources/bl…
This is interesting...
Apple ($AAPL) is now trading at nearly 11x sales, the highest valuation level in company history
Great post by @charliebilello
